Learn how to install PNP4Nagios on CentOS 7 with this detailed guide. Enhance your Nagios monitoring setup with performance data graphing and visualization. #centlinux #linux #nagios
Table of Contents
Problem Statement
In search of a graph add-on for Nagios, we have already explored the Nagiosgraph, although it works fine. But we kept looking for other alternates to Nagiosgraph. This is how PNP4Nagios pulls our attention towards it. PNP4Nagios is an add-on to Nagios which analyzes performance data provided by plugins and stores them automatically into RRD-databases (Round Robin Databases).
What is PNP4Nagios?
PNP4Nagios is an add-on for Nagios that provides performance data graphing and visualization. It works by processing the performance data output from Nagios plugins and storing this data in a way that can be visualized through graphs and charts. Here are some key features of PNP4Nagios:
- Performance Data Collection: PNP4Nagios collects performance data from Nagios checks and plugins.
- Data Storage: The collected data is stored in RRD (Round Robin Database) files, which are efficient for time-series data.
- Graphing: It generates graphs from the stored data, making it easy to visualize trends and performance metrics over time.
- Integration: PNP4Nagios integrates seamlessly with Nagios, providing a web interface for viewing the graphs alongside Nagios alerts and checks.
- Customization: Users can customize the appearance and settings of the graphs to meet specific monitoring needs.
PNP4Nagios enhances the functionality of Nagios by providing a powerful tool for monitoring performance data, helping administrators to identify trends, diagnose issues, and optimize system performance.
Before moving forward, it is required to have basic concepts of Nagios Core 4. Therefore, it is highly recommended that you should have Learning Nagios – Third Edition (PAID LINK). It will be really helpful for you during your Nagios journey.
Nagios Server Specification
In this article, we will install PNP4Nagios plugin on our Nagios Core Server over CentOS 7.
PNP4Nagios can be configured in different ways like SYNC, BULK, BULK+NPCD, etc. Although the SYNC mode is claimed to has the most straight forward configurations, but unfortunately it didn’t work for me due to some bug (related to Environment Variables) in Nagios 4.x. Therefore, I switched to BULK+NPCD mode.
We have configured a CentOS 7 virtual machine with Nagios Server having following specifications.
- CPU – 2.4 Ghz (1 Core)
- Memory – 1 GB
- Storage – 20 GB
- Swap – 2 GB
- Operating System – CentOS 7.6
- Nagios Version – Nagios Core 4.4
- IP Address – 192.168.229.131/24
Read Also: Grafana PNP4Nagios Configuration on CentOS 7
Install PNP4Nagios on Nagios Core
Install prerequisites packages using yum.
# yum install rrdtool rrdtool-perl perl-Time-HiRes perl-GD -y
Download the latest tarball of PNP4Nagios from http://www.pnp4nagios.org/.
Go to the directory in which you have downloaded the PNP4Nagios tarball, and extract it.
# cd /soft/nagios
# tar xvf pnp4nagios-0.6.25.tar.gz
Go the directory, where PNP4Nagios is extracted, and install it.
# cd pnp4nagios-0.6.25
# ./configure
# make all
# make fullinstall
PNP4Nagios Configuration
Edit nagios.cfg and comment (#) all performance parameters.
# vi /usr/local/nagios/etc/nagios.cfg
Add following parameters in nagios.cfg.
process_performance_data=1
# service performance data
service_perfdata_file=/usr/local/pnp4nagios/var/service-perfdata
service_perfdata_file_template=DATATYPE::SERVICEPERFDATAtTIMET::$TIMET$tHOSTNAME::$HOSTNAME$tSERVICEDESC::$SERVICEDESC$tSERVICEPERFDATA::$SERVICEPERFDATA$tSERVICECHECKCOMMAND::$SERVICECHECKCOMMAND$tHOSTSTATE::$HOSTSTATE$tHOSTSTATETYPE::$HOSTSTATETYPE$tSERVICESTATE::$SERVICESTATE$tSERVICESTATETYPE::$SERVICESTATETYPE$
service_perfdata_file_mode=a
service_perfdata_file_processing_interval=15
service_perfdata_file_processing_command=process-service-perfdata-file

# host performance data
host_perfdata_file=/usr/local/pnp4nagios/var/host-perfdata
host_perfdata_file_template=DATATYPE::HOSTPERFDATAtTIMET::$TIMET$tHOSTNAME::$HOSTNAME$tHOSTPERFDATA::$HOSTPERFDATA$tHOSTCHECKCOMMAND::$HOSTCHECKCOMMAND$tHOSTSTATE::$HOSTSTATE$tHOSTSTATETYPE::$HOSTSTATETYPE$
host_perfdata_file_mode=a
host_perfdata_file_processing_interval=15
host_perfdata_file_processing_command=process-host-perfdata-file
Now edit commands.cfg.
# vi /usr/local/nagios/etc/objects/commands.cfg
Add following commands in commands.cfg.
define command{
       command_name    process-service-perfdata-file
       command_line    /bin/mv /usr/local/pnp4nagios/var/service-perfdata /usr/local/pnp4nagios/var/spool/service-perfdata.$TIMET$
}

define command{
       command_name    process-host-perfdata-file
       command_line    /bin/mv /usr/local/pnp4nagios/var/host-perfdata /usr/local/pnp4nagios/var/spool/host-perfdata.$TIMET$
}
Start and enable npcd service.
# /usr/local/pnp4nagios/bin/npcd -d -f /usr/local/pnp4nagios/etc/npcd.cfg
# systemctl enable npcd.service
Restart nagios and httpd services.
# systemctl restart nagios.service
# systemctl restart httpd.service
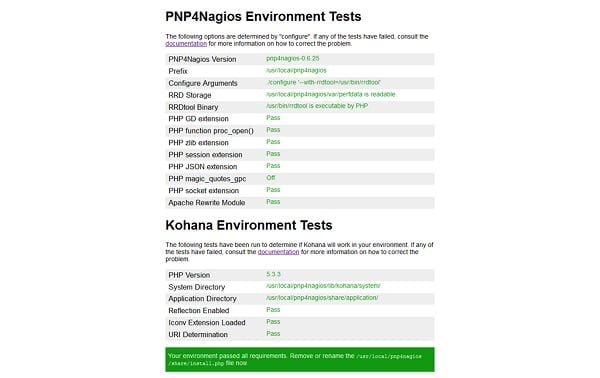
Open the URL http://192.168.229.131/pnp4nagios in a client’s browser to check configurations, and if there is a failure in environment test then rectify it. (Change the IP address to your Nagios server’s here.)

It didn’t show me any failure.
Now remove the file /usr/local/pnp4nagios/share/install.php
# rm -f /usr/local/pnp4nagios/share/install.php
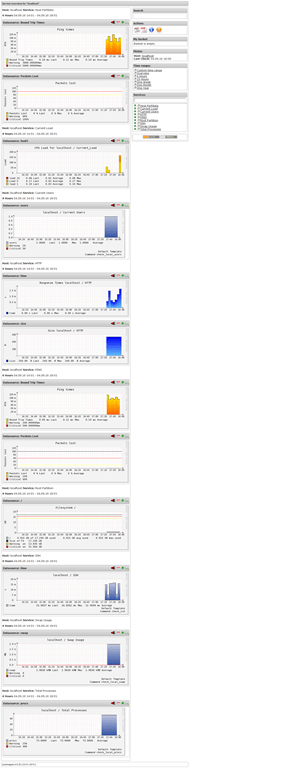
Again, open the URL http://192.168.229.131/pnp4nagios in a client’s browser and this time you will see the graphs.

We have successfully installed PNP4Nagios plugin on our Nagios Core Server over CentOS 7.
Recommended Online Training: Learn Bash Shell in Linux for Beginners

Final Thoughts
Installing PNP4Nagios on CentOS 7 is a great way to enhance your Nagios monitoring setup with powerful performance data graphing and visualization. By following this guide, you can successfully set up PNP4Nagios and gain deeper insights into your system’s performance.
If you need further assistance or prefer to have a professional handle the installation, I’m here to help! Check out my Fiverr service: Linux Technical Support for expert support in setting up PNP4Nagios and other server-related tasks.
Sound Achievement. Its really good.
Thanks Aqib.
Thank you, working with new 4.2.1 too.
Hello , thanks for the tuto it work smoothly,
There is a missing thing, that after installing pnp4nagios and it gave me all the wanted graphs, i can't export it as PDF and notice said that "php gd functions are missing", in my case I fixed it with installing php-gd wih the commande "yum install php-gd"
maybe you can invoke it in the prerequisites packages.
Thanks for your advice.
Thanks for appreciation.
how can i do it in debian ???
Hi,
I haven't work on this scenario yet. On your request, I am adding it to the pipeline. Hopefully, you may find the required article on this Blog very soon.
Hi Ahmer ,
Thanks for this instruction to install the pnp4nagios , once i insalled a follow the instruction the web shows only the hostpref no servicepref note i installed the nagiosgraph before
is that the reason and how to override it ?
Hi,
Please check
1)service_perfdata related parameters in nagios.cfg file
2)process-service-perfdata-file command in commands.cfg file
Great Tutorial! Thank You
i try to install pnp4nagios on my rhel 6 when i run on my browser http://nagiosserver ip/pnp4nagios it's asking me username and password i want to authenticate with nagiosadmin account please help
PNP4Nagios is a plugin for Nagios. Nagios didn't have any native authentication method. Therefore, we set HTTP basic authentication to control user access.
Remove the HTTP basic authentication and it won't ask you for any user/password.