Learn how to configure Grafana with PNP4Nagios on CentOS 7 to enhance your network monitoring and visualization capabilities. Step-by-step guide for seamless integration. #centlinux #linux #grafana #nagios
Table of Contents
What is Grafana ?
Grafana is a free and open source software to create graphs of numeric time-series data such as performance data of computer systems. Grafana is biggest alternative visualization tool for Graphite today. Grafana can collect data from various data sources like Elastic Search, InfluxDB, CloudWatch, etc. Grafana support different types of graphical panels including Graphs, Heatmaps and Tables.

System Specification
In this article, we will install Grafana on CentOS 7 and integrate Grafana with Nagios Core via PNP4Nagios plugin.
For Simple Grafana PNP4Nagios configuration, we are installing Nagios and Grafana on same machine, however, each of them can be installed on individual machine if required.
We have provisioned a CentOS 7 virtual machine with following specifications:
- Hostname – nagios-01.example.com
- IP Address – 192.168.116.143/24
- Operating System – CentOS 7.6
- Nagios Version – Nagios Core 4.4
Read Also: How to install NagiosQL on CentOS 7
Before moving forward, it is required to have basic concepts of Nagios Core 4. Therefore, it is highly recommended that you should join:
Recommended Training: Nagios | Ultimate IT monitoring guide with EyesOfNetwork from Tech Academy

Install Nagios on Linux Server
First of all, we required to configure a Nagios Core server to collect performance data from network and computers.
The procedure of installing Nagios Core is already described in our previous article Install Nagios on CentOS 7.
Therefore, instead of reinventing the wheel, we are moving to next step.
Install PNP4Nagios on CentOS 7
We have already wrote an article Install PNP4Nagios on CentOS 7. Therefore, you should follow it to install and configure PNP4Nagios.
Install Grafana on CentOS 7
Browse URL http://docs.grafana.org/installation/rpm/ and download Grafana according to your operating system and platform.
wget https://dl.grafana.com/oss/release/grafana-5.4.3-1.x86_64.rpmInstall Grafana using yum command.
yum install -y grafana-5.4.3-1.x86_64.rpmStart and enable Grafana service.
systemctl daemon-reload
systemctl enable grafana-server.service
systemctl start grafana-server.service
Configure Linux Firewall
Allow Grafana service port in Linux Firewall.
firewall-cmd --permanent --add-port=3000/tcp
firewall-cmd --reload
GKLSPL 65W USB C Laptop Charger Compatible with Dell Laptop Charger and More Chromebook Type C Power Cord
$8.99 (as of July 4, 2025 20:44 GMT +00:00 – More infoProduct prices and availability are accurate as of the date/time indicated and are subject to change. Any price and availability information displayed on [relevant Amazon Site(s), as applicable] at the time of purchase will apply to the purchase of this product.)Grafana PNP4Nagios Configuration
Install PNP plugin for Grafana.
grafana-cli plugins install sni-pnp-datasourceOutput:
installing sni-pnp-datasource @ 1.0.5
from url: https://grafana.com/api/plugins/sni-pnp-datasource/versions/1.0.5/download
into: /var/lib/grafana/plugins

â Installed sni-pnp-datasource successfully

Restart grafana after installing plugins . <service grafana-server restart>
Download Grafana API.
cd /usr/local/pnp4nagios/share/application/controllers/
wget -O api.php "https://github.com/lingej/pnp-metrics-api/raw/master/application/controller/api.php"
Restart Grafana service.
systemctl restart grafana-server.serviceAllow Access to PNP4Nagios web service by Grafana execute following or manually edit /etc/httpd/conf.d/pnp4nagios.conf file.
sed -i '/Allow from all/a        Allow from 127.0.0.1 ::1' /etc/httpd/conf.d/pnp4nagios.conf
sed -i '/Require valid-user/a        Require all granted' /etc/httpd/conf.d/pnp4nagios.conf
sed -i 's/Allow from all/#&/' /etc/httpd/conf.d/pnp4nagios.conf
sed -i 's/AuthName/#&/' /etc/httpd/conf.d/pnp4nagios.conf
sed -i 's/AuthType Basic/#&/' /etc/httpd/conf.d/pnp4nagios.conf
sed -i 's/AuthUserFile/#&/' /etc/httpd/conf.d/pnp4nagios.conf
sed -i 's/Require valid-user/#&/' /etc/httpd/conf.d/pnp4nagios.conf
Restart Apache service.
systemctl restart httpd.serviceTest PNP4Nagios web service is locally accessed without authentication.
curl http://localhost/pnp4nagiosOutput:
<!DOCTYPE HTML PUBLIC "-//IETF//DTD HTML 2.0//EN">
<html><head>
<title>301 Moved Permanently</title>
</head><body>
<h1>Moved Permanently</h1>
<p>The document has moved <a href="http://localhost/pnp4nagios/">here</a>.</p>
</body></html>
We have obtained a 301 redirection error, it means that our configurations are OK.
Redragon M908 Impact RGB LED MMO Gaming Mouse with 12 Side Buttons, Optical Wired Ergonomic Mouse with Max 12,400DPI, High Precision, 18 Programmable Macro Shortcuts, Comfort Grip
$27.89 (as of July 4, 2025 23:12 GMT +00:00 – More infoProduct prices and availability are accurate as of the date/time indicated and are subject to change. Any price and availability information displayed on [relevant Amazon Site(s), as applicable] at the time of purchase will apply to the purchase of this product.)Configure PNP4Nagios as a Data Source for Grafana
Browse the URL https://nagios-01.example.com:3000.

Login with default username admin and password admin.
Since, we are login for the first time on Grafana, therefore it will ask you to change the admin user’s password.

Set a new password and click on Save.
You are now at the Grafana Dashboard.
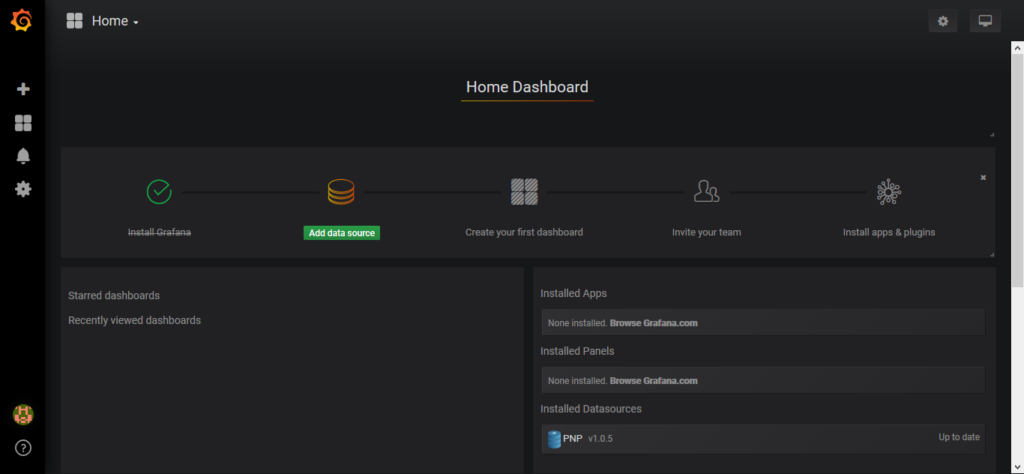
Click on Add Data Source.
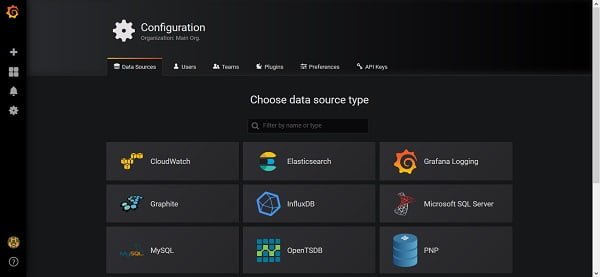
Choose the data source type here as PNP.
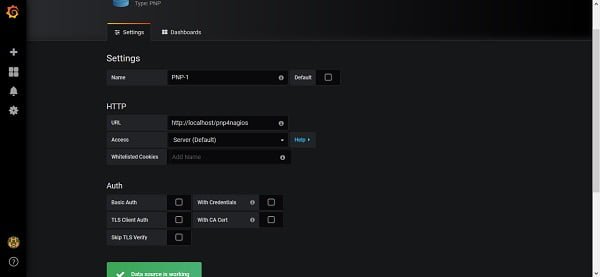
Enter configurations as above and click on Save & Test.
If the configurations are correct then Grafana will display “Data source is working”.
We have defined a data source PNP-1, now we have to create a dashboard for the data from our data source.
Click on the left toolbar to create a dashboard.
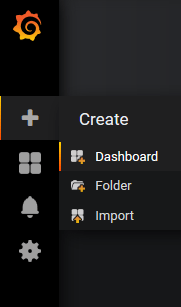
When click on Dashboard, it will ask you for the Panel type that we want to add in our Dashboard.
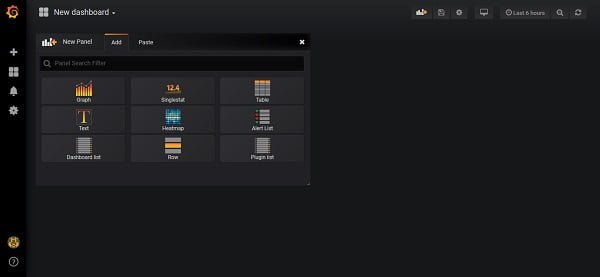
Let’s add a graph panel by clicking on Graph.
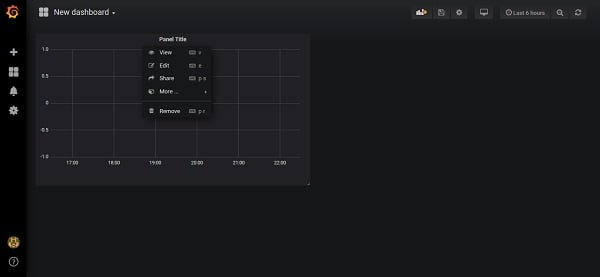
Click on Edit to add a data query.
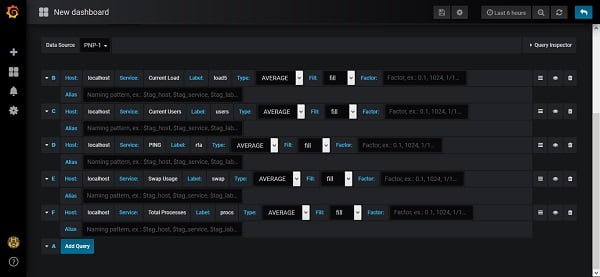
We have defined a sample data query above.
Click on Save icon on top toolbar.
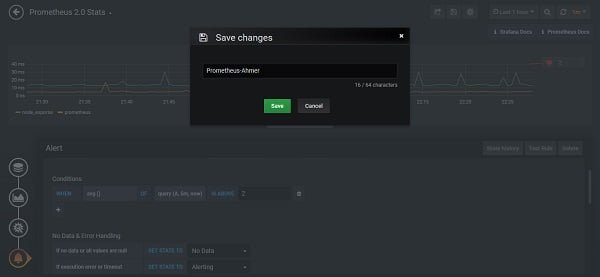
Enter a Dashboard Name and click on Save.
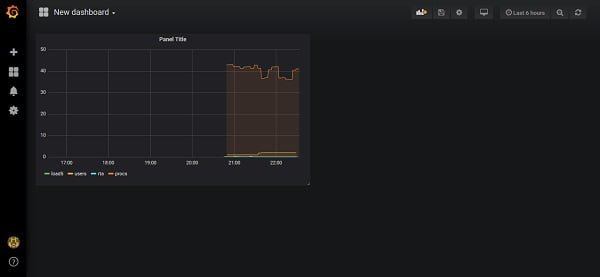
Grafana has been collecting data from Nagios Core via PNP and display it in our Panel.
In this guide, you have learned about Grafana PNP4Nagios configuration. Although this article demonstrates a single type of Dashboard and Panel but you can experiment on your own to explore and design custom dashboards according to your requirement.
Frequently Asked Questions (FAQs)
What is PNP4Nagios, and why use it with Grafana?
PNP4Nagios is a performance data visualization tool for Nagios that stores metrics in RRD files. Grafana can fetch this data to create advanced, customizable dashboards.
Do I need Nagios installed before setting up PNP4Nagios?
Yes, PNP4Nagios relies on Nagios for collecting performance data. Ensure Nagios is properly installed and running before configuring PNP4Nagios.
What are the key requirements for Grafana to read PNP4Nagios data?
Grafana needs a compatible data source plugin (like Graphite or InfluxDB) to query PNP4Nagios’ stored RRD data. Proper permissions for Grafana to access RRD files are also necessary.
How do I verify if PNP4Nagios is collecting data correctly?
Check the Nagios web interface for performance graphs under host/service details. If graphs appear, PNP4Nagios is working.
Can I use Grafana without modifying PNP4Nagios’ default settings?
Yes, but you may need to adjust Grafana’s data source configuration to match PNP4Nagios’ storage paths and naming conventions for smooth integration.
The Ultimate Ubuntu Handbook: A complete guide to mastering Ubuntu 24.04—from installation to advanced security and development
$49.99 (as of July 4, 2025 20:44 GMT +00:00 – More infoProduct prices and availability are accurate as of the date/time indicated and are subject to change. Any price and availability information displayed on [relevant Amazon Site(s), as applicable] at the time of purchase will apply to the purchase of this product.)Final Thoughts
Configuring Grafana with PNP4Nagios on CentOS 7 allows you to visualize Nagios performance data through interactive and customizable dashboards. This integration enhances your monitoring capabilities by combining Nagios’s powerful alerting with Grafana’s rich visualization tools.
By completing the steps to install Grafana, configure PNP4Nagios as a data source, and set up dashboards, you’ve created a modern monitoring solution that delivers both detailed insights and ease of use. Regular maintenance and tuning will ensure optimal performance and data accuracy.
Need a dependable Linux system administrator? I specialize in managing, optimizing, and securing Linux servers to keep your operations running flawlessly. Check out my services on Fiverr!
Optimize your monitoring with a seamless Grafana and PNP4Nagios integration today!


Leave a Reply
You must be logged in to post a comment.