Learn how to effortlessly install Grafana on Rocky Linux 9 with our comprehensive guide. Unlock powerful visualization and monitoring capabilities to optimize your system’s performance effectively. #centlinux #linux #grafana
Table of Contents
What is Grafana?
Grafana is an open-source data visualization and monitoring tool used for analyzing and monitoring time-series data. It provides a rich set of features and a flexible and customizable platform for creating interactive dashboards and graphs. Grafana supports a wide range of data sources, including popular databases like MySQL, PostgreSQL, and Prometheus, as well as cloud services like AWS CloudWatch and Google Analytics.
With Grafana, you can connect to various data sources, query the data, and create visually appealing and informative dashboards. It offers a web-based interface that allows users to build and configure their dashboards using a drag-and-drop approach. You can add different panels to a dashboard, such as graphs, tables, or gauges, and customize them with various visualization options and settings.
Grafana also supports alerting and notification features, allowing you to set up alerts based on defined thresholds or conditions. When a threshold is breached or a condition is met, Grafana can send notifications via email, Slack, PagerDuty, or other messaging platforms.
Overall, Grafana is widely used in the field of DevOps and system monitoring to monitor infrastructure, applications, and services, providing real-time insights into the performance and health of systems. It is highly extensible and has a large community of contributors, which ensures continuous development and integration with various data sources and technologies.
Read Also: How to install Grafana on Rocky Linux 8

What is Grafana Agent?
The Grafana Agent is an open-source telemetry agent developed by Grafana Labs. It is designed to collect, process, and send metrics, logs, and traces from various sources to monitoring and observability platforms like Grafana Cloud or Grafana Enterprise.
Key features of the Grafana Agent include:
- Efficient Metric Collection: It efficiently collects metrics from systems, services, and applications, supporting various metric formats and protocols such as Prometheus exposition format.
- Log Collection and Forwarding: The Grafana Agent can collect logs from files and forward them to centralized logging systems or storage solutions.
- Tracing Support: It supports distributed tracing by collecting and forwarding traces from applications instrumented with OpenTelemetry or other tracing libraries.
- Resource Efficiency: The Agent is designed to be lightweight and resource-efficient, suitable for deployment in various environments including containers, virtual machines, and bare-metal servers.
- Integration with Grafana: The Grafana Agent seamlessly integrates with Grafana for visualization, alerting, and analysis of collected metrics, logs, and traces.
Overall, the Grafana Agent simplifies the process of collecting telemetry data and forwarding it to Grafana or other compatible monitoring platforms, enabling organizations to gain insights into the performance and health of their systems.
Environment Specification
We are using a minimal Rocky Linux 9 virtual machine with following specifications.
- CPU – 3.4 Ghz (2 cores)
- Memory – 2 GB
- Storage – 20 GB
- Operating System – Rocky Linux release 9.2 (Blue Onyx)
- Hostname – grafana-01.centlinux.com
- IP Address – 192.168.116.133/24
When setting up a virtual lab for Grafana on Rocky Linux 9, choosing the right hardware or hosting environment can make a big difference. For a home lab setup, a powerful yet compact Mini PC from Amazon is an excellent choice, giving you the flexibility to run multiple Linux servers, containers, and monitoring tools without taking up much space. [Check our recommended Mini PC at Amazon]
On the other hand, if you prefer a cloud-based approach, Rose Hosting VPS provides reliable performance with full root access, making it ideal for deploying Grafana in a production-like environment. Both options ensure you can practice, experiment, and build a stable monitoring stack with confidence. [Get a Rose Hosting VPS Now!]
Disclaimer: Some of the links mentioned above are affiliate links, which means I may earn a small commission if you make a purchase through them — at no extra cost to you. This helps support the blog and allows me to continue creating free technical content.
Prepare your Rocky Linux Server
By using a ssh client, login on your Linux server as root user.
Set a fully qualified domain name (FQDN) for your Linux machine as follows.
hostnamectl set-hostname grafana-01.centlinux.comUpdate software packages in your Linux OS by using dnf command.
dnf update -yIf the previous command updates your Linux Kernel, then you should reboot your machine with the newly installed Kernel.
rebootNote down the versions of Linux OS and Kernel that are being used in this tutorial.
cat /etc/rocky-release
uname -r
Output:
Rocky Linux release 9.2 (Blue Onyx)
5.14.0-284.11.1.el9_2.x86_64
Installing Grafana Official Yum Repository
Grafana software can be downloaded directly from its official website or from its GitHub repository, where you’ll find the latest releases and source code. However, when working with Red Hat-based Linux distributions such as CentOS, Rocky Linux, or AlmaLinux, the recommended and most efficient approach is to add Grafana’s official YUM repository to your system. By doing so, you ensure that the installation is streamlined and that future updates are easily managed.
Once the repository is added, you can use the dnf package manager to install Grafana, enabling you to quickly set up this powerful data visualization and monitoring tool. This method not only simplifies installation but also ensures compatibility and seamless integration with your operating system’s package management system, keeping Grafana up-to-date with minimal effort.
Create a .repo file by using vim text editor.
vi /etc/yum.repos.d/grafana.repoAdd following directives in this file.
[grafana]
name=grafana
baseurl=https://rpm.grafana.com
repo_gpgcheck=1
enabled=1
gpgcheck=1
gpgkey=https://rpm.grafana.com/gpg.key
sslverify=1
sslcacert=/etc/pki/tls/certs/ca-bundle.crt
exclude=*beta*
After installing Grafana repository, rebuild your yum cache.
dnf makecacheInstall Grafana on Rocky Linux 9
Check the information about grafana software package.
dnf info grafana.x86_64Output:
Last metadata expiration check: 0:11:58 ago on Sun 21 May 2023 12:41:12 AM PKT.
Installed Packages
Name         : grafana
Version      : 9.5.2
Release      : 1
Architecture : x86_64
Size         : 273 M
Source       : grafana-9.5.2-1.src.rpm
Repository   : @System
From repo    : grafana
Summary      : Grafana
URL          : https://grafana.com
License      : AGPLv3
Description  : Grafana
Now, you can install Grafana on Linux by executing dnf command.
dnf install -y grafanaIn this Linux tutorial, we are installing Open-source edition of Grafana server. Alternatively, you can also install Grafana Enterprise edition by running following command.
dnf install -y grafana-enterpriseEnable and start Grafana service.
systemctl enable --now grafana-serverVerify the status of the Grafana service to ensure it is running correctly and to identify any potential errors or issues. By checking the service status, you can gather detailed information about its current state, such as whether it is active, inactive, or has encountered problems during startup. This step is crucial for diagnosing and troubleshooting any configuration or runtime issues. Use the appropriate system management tools to review logs and error messages, which will help you pinpoint the root cause and take corrective actions promptly. Regularly monitoring the Grafana service status is essential for maintaining a stable and reliable data visualization setup.
systemctl status grafana-serverOutput:
● grafana-server.service - Grafana instance
     Loaded: loaded (/usr/lib/systemd/system/grafana-server.service; enabled; p>
     Active: active (running) since Sun 2023-05-21 00:28:43 PKT; 40s ago
       Docs: http://docs.grafana.org
   Main PID: 5695 (grafana)
      Tasks: 7 (limit: 23011)
     Memory: 66.2M
        CPU: 8.236s
     CGroup: /system.slice/grafana-server.service
             └─5695 /usr/share/grafana/bin/grafana server --config=/etc/grafana>

May 21 00:28:43 grafana-01.centlinux.com grafana[5695]: logger=modules t=2023-0>
May 21 00:28:43 grafana-01.centlinux.com systemd[1]: Started Grafana instance.
May 21 00:28:43 grafana-01.centlinux.com grafana[5695]: logger=grafanaStorageLo>
May 21 00:28:43 grafana-01.centlinux.com grafana[5695]: logger=http.server t=20>
May 21 00:28:43 grafana-01.centlinux.com grafana[5695]: logger=ngalert.state.ma>
May 21 00:28:43 grafana-01.centlinux.com grafana[5695]: logger=ngalert.state.ma>
May 21 00:28:43 grafana-01.centlinux.com grafana[5695]: logger=ticker t=2023-05>
May 21 00:28:43 grafana-01.centlinux.com grafana[5695]: logger=ngalert.multiorg>
May 21 00:28:43 grafana-01.centlinux.com grafana[5695]: logger=plugins.update.c>
May 21 00:28:43 grafana-01.centlinux.com grafana[5695]: logger=grafana.update.c>
To ensure your Grafana dashboards are accessible across your network, it is essential to configure your Linux firewall to allow traffic for the Grafana service. By default, firewalls are set to block incoming connections for security purposes, so you’ll need to create an exception for Grafana. This involves enabling the appropriate port (usually 3000) used by Grafana in your firewall rules. Adjusting these settings allows users within the network to access the Grafana web interface seamlessly, enabling real-time monitoring and visualization of metrics. Proper firewall configuration is a critical step in integrating Grafana into your system while maintaining security.
firewall-cmd --permanent --add-service=grafana
firewall-cmd --reload
Access Grafana Dashboards
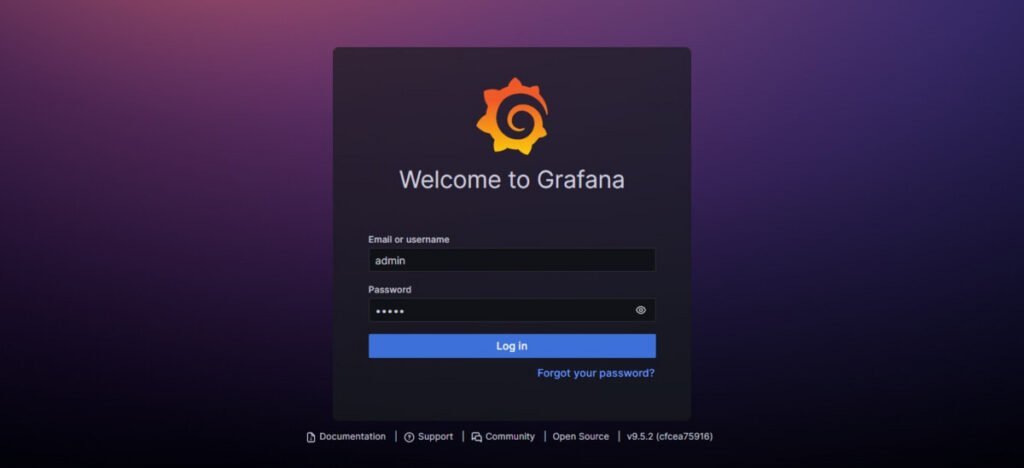
Open URL http://grafana-01.centlinux.com:3000 in a web browser.

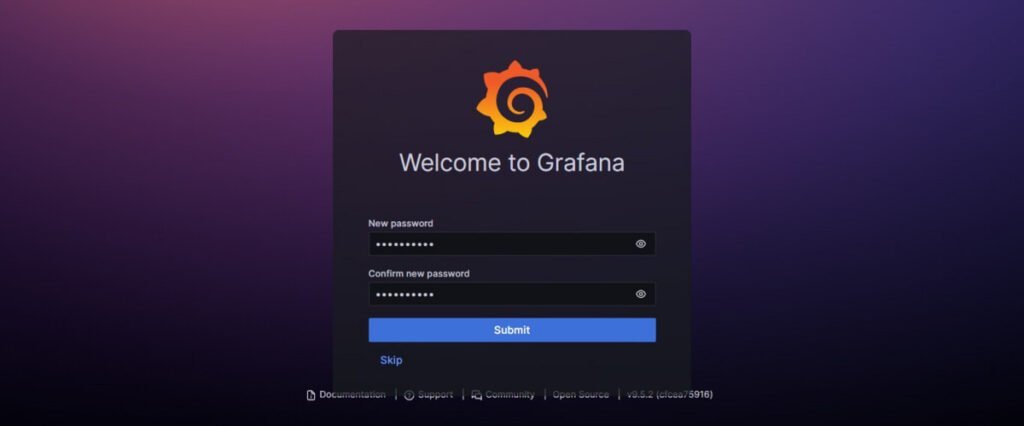
Accessing your Grafana dashboards is straightforward. To log in, navigate to the Grafana web interface using your browser, typically accessible at http://<server-ip>:3000 or http://localhost:3000 if you’re on the same machine. Use the default credentials: username admin and password admin. Once logged in, you will be prompted to change the default password for security purposes. It is highly recommended to choose a strong and unique password to protect your Grafana instance from unauthorized access. This simple initial setup will grant you access to Grafana’s powerful dashboarding and visualization features.

Set a new strong password for your Grafana admin user.

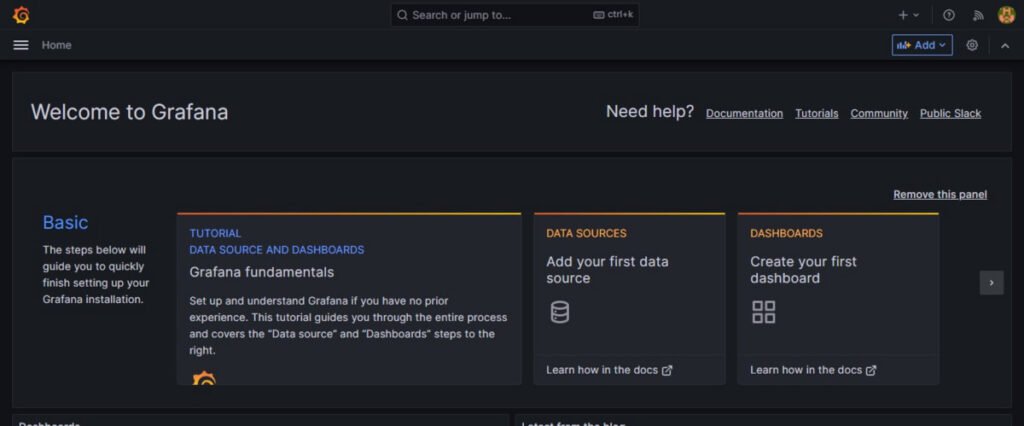
You have successfully login to Grafana web application.
Video Tutorial
Frequently Asked Questions (FAQs)
1. How can I implement row-level permissions in Grafana dashboards?
Grafana does not natively support row-level permissions. However, you can use dashboard variables with $_ _filter expressions or implement external authorization via APIs and data source permissions to restrict data access.
2. What’s the best way to automate dashboard provisioning in Grafana?
Use Terraform with Grafana’s provisioning API, or define dashboards as code using JSON/YAML files stored in version control and deployed via Grafana’s provisioning (config files in /etc/grafana/provisioning/).
3. How do I set up high availability (HA) for Grafana?
Deploy multiple Grafana instances behind a load balancer with a shared database (e.g., PostgreSQL/MySQL) and configure session storage (Redis) for state consistency. Avoid file-based storage for dashboards.
4. Can Grafana alert on anomalies or forecasting?
Yes, using Grafana Machine Learning (ML) or integrations like Prometheus’s predict_linear() or Loki’s log anomaly detection. Alternatively, use external tools (e.g., Prophet, TensorFlow) and feed results into Grafana alerts.
5. How do I reduce dashboard load times with large datasets?
Optimize by:
Using time-range shortcuts and downsampling (e.g., Grafana’s $__interval).
Leveraging caching (Redis/Memcached) for queries.
Moving heavy computations to the database (e.g., aggregations in PostgreSQL or ClickHouse).
Final Thoughts
Embark on the journey to enhance your system’s monitoring capabilities by installing Grafana on Rocky Linux 9. With our comprehensive guide, navigating the installation process becomes a breeze, unlocking the power of visualization and monitoring for your infrastructure. Let’s empower your system with Grafana and pave the way for insightful analytics and proactive performance management.
Optimize your cloud infrastructure and secure your servers with my AWS and Linux administration services. Let’s ensure your systems run smoothly. Connect with me now! if you need any guidance or advice related to your Linux VPS.
What’s Next
If you’re looking to master modern monitoring and observability, the “Observability with Grafana, Prometheus, Loki, Alloy, and Tempo” by Aref Karimi is a highly practical online course that guides you through building a complete observability stack from scratch. Whether you’re a DevOps engineer, cloud professional, or system administrator, this course will help you gain hands-on expertise in metrics, logs, and traces using industry-leading tools. It’s an excellent investment to boost your career and stay ahead in today’s cloud-native world.
Disclaimer: This post contains affiliate links. If you purchase through these links, I may earn a small commission at no extra cost to you.


Leave a Reply
You must be logged in to post a comment.