Learn how to install Nagiosgraph on CentOS 7 with this comprehensive guide. Enhance your Nagios monitoring by adding advanced graphing capabilities. #centlinux #linux #nagios
Table of Contents
Problem Statement
Nagios Core has limited native support for graphical representation of metrics. Nagiosgraph is very useful plugin, that extends the functionality of Nagios Core and display historical graphs. Nagiosgraph parses output and performance data collected by Nagios and stores that data in RRD (Round Robin Data) files. Nagiosgraph creates graphs and generates HTML pages with graphical reports from the data.

What is Nagiosgraph?
Nagiosgraph is an add-on for Nagios that provides graphing capabilities for the performance data collected by Nagios. It processes the performance data output from Nagios checks and plugins, stores it, and generates graphs to help visualize trends and metrics over time. Here are some key features of Nagiosgraph:
- Performance Data Collection: Captures performance data from Nagios plugins and checks.
- Data Storage: Stores the collected data in a format that can be used for generating graphs.
- Graphing: Automatically generates graphs from the stored performance data, making it easy to visualize and analyze trends.
- Integration with Nagios: Seamlessly integrates with Nagios, providing a web interface to view the graphs alongside Nagios alerts and status information.
- Customization: Allows users to customize the appearance and configuration of graphs to suit their monitoring needs.
Nagiosgraph enhances the functionality of Nagios by providing a powerful tool for visualizing performance data, helping administrators to better understand system performance, identify issues, and optimize their infrastructure.
If you’re serious about mastering IT infrastructure monitoring, the Zabbix Application and Network Monitoring by Sean Bradley course is a must-have resource. This practical training walks you through real-world scenarios to monitor servers, applications, and networks with confidence, making it ideal for system administrators, DevOps engineers, and IT professionals aiming to level up their skills. By enrolling, you’ll gain hands-on knowledge that can save countless hours in troubleshooting and system management. [Click here to check out the course]
Disclaimer: This link is an affiliate link, which means I may earn a small commission at no extra cost to you if you decide to purchase through it. This helps support my blog and allows me to continue creating useful content.
Read Also: How to install Nagios on CentOS 8
Nagios Server Specification
In this article, we will install Nagiosgraph plugin to our preconfigured Nagios Core server on CentOS 7.
We have configured a CentOS 7 virtual machine with Nagios Core 4.2 Server and following specifications.
- CPU – 2.4 Ghz (2 Core)
- Memory – 1 GB
- Storage – 20 GB
- Swap – 2 GB
- Operating System – CentOS 7.6
- Nagios Version – Nagios Core 4.4
Install Nagiosgraph on CentOS 7
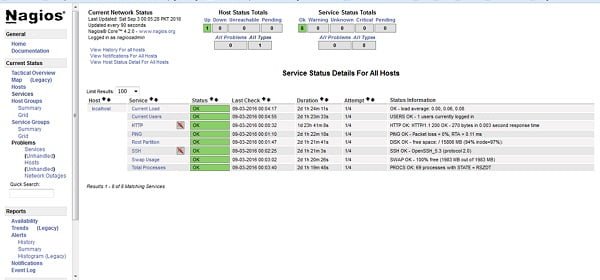
Access the Nagios Core’s web interface to check its status.

Install the prerequisite packages using yum command.
yum -y install perl-GD php-gd rrdtool-perl rrdtool-php rrdtool perl-CGI perl-Time-HiResCreate a directory and download Nagiosgraph 1.5.2 (the latest version at the time of this writeup) from Nagiosgraph – Official Page.
mkdir -p /soft/nagios
cd /soft/nagios
wget https://sourceforge.net/projects/nagiosgraph/files/nagiosgraph/1.5.2/nagiosgraph-1.5.2.tar.gz
Extract the contents of Nagiosgraph tarball.
cd /soft/nagios
tar xvf nagiosgraph-1.5.2.tar.gz
Check prerequisites and install Nagiosgraph.
cd /soft/nagios/nagiosgraph-1.5.2
./install.pl --check-prereq
./install.pl --layout overlay --prefix /usr/local/nagios
During the installation, set the paths as follows:
(If you define the paths correctly, then most of the configurations will be automatically make by Nagiosgraph installer)
Destination directory (prefix)? [/usr/local/nagios]
Location of configuration files (etc-dir)? [/usr/local/nagios/etc/nagiosgraph]
Location of executables? [/usr/local/nagios/libexec]
Location of CGI scripts? [/usr/local/nagios/sbin]
Location of documentation (doc-dir)? [/usr/local/nagios/docs/nagiosgraph]
Location of examples? [/usr/local/nagios/docs/nagiosgraph/examples]
Location of CSS and JavaScript files? [/usr/local/nagios/share]
Location of utilities? [/usr/local/nagios/docs/nagiosgraph/util]
Location of state files (var-dir)? [/var/nagios] /usr/local/nagios/var
Location of RRD files? [/usr/local/nagios/var/rrd]
Location of log files (log-dir)? [/var/nagios] /usr/local/nagios/var
Path of log file? [/usr/local/nagios/var/nagiosgraph.log]
Path of CGI log file? [/usr/local/nagios/var/nagiosgraph-cgi.log]
Base URL? [/nagios]
URL of CGI scripts? [/nagios/cgi-bin]
URL of CSS file? [/nagios/nagiosgraph.css]
URL of JavaScript file? [/nagios/nagiosgraph.js]
URL of Nagios CGI scripts? [/nagios/cgi-bin]
Path of Nagios performance data file? [/tmp/perfdata.log] /usr/local/nagios/var/service-perfdata.log
username or userid of Nagios user? [nagios]
username or userid of web server user? [apache]
Edit /usr/local/nagios/etc/nagios.cfg file and comment (#) all the performance related parameters.
vi /usr/local/nagios/etc/nagios.cfgSet following parameters, to enable Nagios to keep history of performance data.
# process nagios performance data using nagiosgraph
process_performance_data=1
service_perfdata_file=/usr/local/nagios/var/service-perfdata.log
service_perfdata_file_template=$LASTSERVICECHECK$||$HOSTNAME$||$SERVICEDESC$||$SERVICEOUTPUT$||$SERVICEPERFDATA$
service_perfdata_file_mode=a
service_perfdata_file_processing_interval=30
service_perfdata_file_processing_command=process-service-perfdata-for-nagiosgraph
Edit /usr/local/nagios/etc/objects/commands.cfg.
vi /usr/local/nagios/etc/objects/commands.cfgAdd following command to to enable storage of performance metrics.
define command {
  command_name process-service-perfdata-for-nagiosgraph
  command_line /usr/local/nagios/libexec/insert.pl
}
Check Nagios configurations now.
/usr/local/nagios/bin/nagios -v /usr/local/nagios/etc/nagios.cfgOutput:
Nagios Core 4.2.0
Copyright (c) 2009-present Nagios Core Development Team and Community Contributors
Copyright (c) 1999-2009 Ethan Galstad
Last Modified: 08-01-2016
License: GPL

Website: https://www.nagios.org
Reading configuration data...
   Read main config file okay...
   Read object config files okay...

Running pre-flight check on configuration data...

Checking objects...
        Checked 8 services.
        Checked 1 hosts.
        Checked 1 host groups.
        Checked 0 service groups.
        Checked 1 contacts.
        Checked 1 contact groups.
        Checked 25 commands.
        Checked 5 time periods.
        Checked 0 host escalations.
        Checked 0 service escalations.
Checking for circular paths...
        Checked 1 hosts
        Checked 0 service dependencies
        Checked 0 host dependencies
        Checked 5 timeperiods
Checking global event handlers...
Checking obsessive compulsive processor commands...
Checking misc settings...

Total Warnings: 0
Total Errors:   0

Things look okay - No serious problems were detected during the pre-flight check
Restart nagios and httpd services to reload new configurations.
systemctl restart nagios
systemctl restart httpd
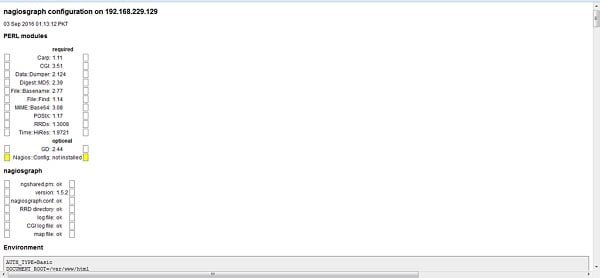
Open URL http://192.168.229.129/nagios/cgi-bin/showconfig.cgi in the browser, to see the configurations. (Replace the IP address in the URL, with your CentOS 7 Server IP address).

You can see that Nagiosgraph has been integrated with Nagios Core.
Edit /usr/local/nagios/etc/objects/templates.cfg file.
vi /usr/local/nagios/etc/objects/templates.cfgAdd following code to define a service graphed-service to be used to display Nagiosgraph graphs.
define service {
      name              graphed-service
      action_url        /nagios/cgi-bin/show.cgi?host=$HOSTNAME&service=$SERVICEDESC
      onMouseOver='showGraphPopup(this)'
      onMouseOut='hideGraphPopup()'
      rel='/nagiosgraph/cgi-bin/showgraph.cgi?host=$HOSTNAME&service=$SERVICEDESC&period=week&rrdopts=-w+450+-j
      register 0
}
And append graphed-service in use parameter of the services, for which you want to draw graphs. We have added it to some services, one service syntax is given below for reference.
define service{
        use                             local-service,graphed-service    ; Name of service template to use
        host_name                       localhost
        service_description             HTTP
        check_command                   check_http
        notifications_enabled           0
        }
Restart nagios service.
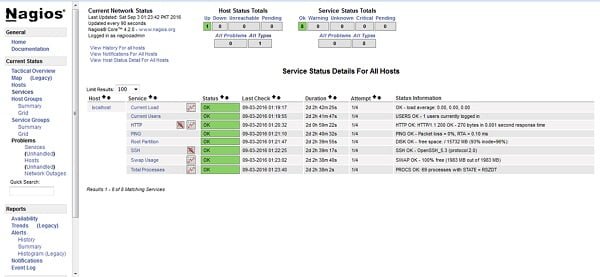
systemctl restart nagiosNow, open the Nagios web interface in browser, you may see the small graph icon infront of the services for which you have enabled graphs.

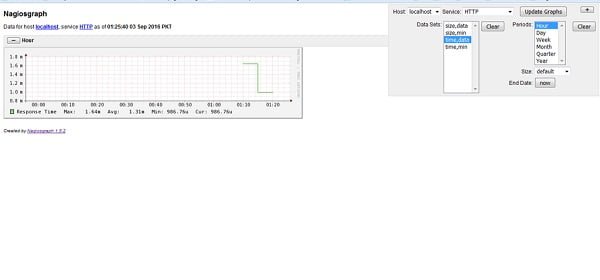
Click on the graph icon to open graphs’ page.

Adjust the parameters on the top right side panel to draw graphs according to your needs.
We have successfully installed Nagiosgraph plugin for Nagios Core on CentOS 7. PNP4Nagios is another addon to display graphs in Nagios Core server. You might like our next article Install PNP4Nagios on Nagios Core over CentOS 7.
Final Thoughts
Installing Nagiosgraph on CentOS 7 adds advanced graphing capabilities to your Nagios monitoring setup, allowing you to visualize performance data effectively. By following this guide, you can set up Nagiosgraph smoothly and enhance your system monitoring.
Searching for a skilled Linux admin? From server management to security, I ensure seamless operations for your Linux systems. Find out more on my Freelancer profile!

Leave a Reply
You must be logged in to post a comment.