Follow our detailed guide to install Prometheus on CentOS 7. Learn how to set up Prometheus for efficient system monitoring and advanced alerting capabilities. #centlinux #linux #prometheus
Table of Contents
What is Prometheus?
Prometheus is a free and open source software application used for event monitoring and alerting. It collects and records real-time metrics in a time series database and alert the users based on custom defined thresholds. Prometheus is written in Go programming language and distributed under Apache License 2.0.

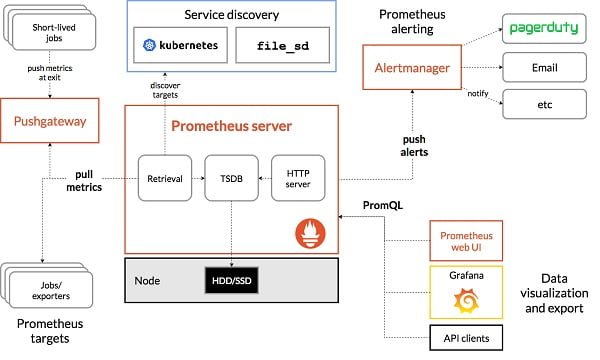
Prometheus requires multiple exporters that must be installed on the target nodes. The exporter generates and publish the metrics on a relevant port on the target node. The Prometheus monitoring server will pull these metrics and store in a time series database. Following architecture diagram from Prometheus Documentation clarifies the concept and flow of the system.
In this guide, we will install Prometheus on CentOS 7 along with node_exporter.

Prometheus Features
Following are the core features of Prometheus.
- Multi-dimensional data model
- Write powerful queries with PromQL
- Grafana integration for great visualization
- Efficient storage (in memory and disk) of time series data
- Precise alerts using Alertmanager
Environment Specification
We have configured a CentOS 7 based Linux virtual machine for this tutorial.
- CPU – 3.4 Ghz (2 cores)
- Memory – 2 GB
- Storage – 20 GB
- Operating System – CentOS 7.7
- Hostname – prometheus-01.example.com
- IP Address – 192.168.116.213 /24
To ensure a smooth installation and optimal performance of Prometheus on CentOS 7, a reliable server environment is crucial. We recommend using the ASUS ROG Strix G16 (2025) Gaming Laptop, which offers robust processing power and ample RAM, ideal for handling Prometheus’ monitoring workloads.
Complement your setup with the Seagate IronWolf 4TB NAS Internal Hard Drive, designed for high durability and continuous operation, perfect for storing time-series data efficiently. Both these best-selling products on Amazon combine performance and reliability, making them excellent choices for your monitoring infrastructure.
Disclaimer: As an Amazon Associate, we earn from qualifying purchases at no additional cost to you.
Configure Prometheus Prerequisites
To begin the installation process, establish a secure SSH connection to the Prometheus server. Use the following command to connect to your CentOS 7 system:
Connect to prometheus-01.example.com using SSH as the root user. This will allow you to perform administrative tasks, including software installation and user management.
As a best practice for security and process isolation, we are creating a dedicated Linux user to own and manage the Prometheus software and its processes. Running Prometheus under a non-root user enhances security by limiting access to critical system files and reducing the risk of unauthorized modifications or potential system vulnerabilities.
This dedicated Prometheus user will be responsible for managing Prometheus services, handling configuration files, and storing monitoring data in a secure manner.
useradd --no-create-home -s /bin/false prometheusCreate required directories for Prometheus Software.
mkdir /etc/prometheus
mkdir /var/lib/prometheus
Change owner and group of these directories to Prometheus.
chown prometheus:prometheus /etc/prometheus
chown prometheus:prometheus /var/lib/prometheus
Install Prometheus on CentOS 7
You can download the Prometheus event monitoring software from its official website or its GitHub repository, where the latest stable releases and source code are maintained. The official distribution includes binaries, configuration files, and sample dashboards to help users quickly set up Prometheus for monitoring infrastructure and applications.
For this installation, we are downloading the latest version of Prometheus Server using the wget command in Linux. Using wget ensures that we fetch the most up-to-date version directly from the Prometheus project maintainers, reducing the risk of outdated or compromised software.
Before downloading, it is recommended to verify the version number from the official Prometheus releases page, ensuring you install a stable and compatible version for your CentOS 7 server.
cd /tmp
wget https://github.com/prometheus/prometheus/releases/download/v2.13.1/prometheus-2.13.1.linux-amd64.tar.gz
Extract downloaded zip file to install Prometheus on CentOS 7.
tar xf prometheus-2.13.1.linux-amd64.tar.gzMove Prometheus files to /var/lib/prometheus directory.
mv prometheus-2.13.1.linux-amd64/* /var/lib/prometheus/Adjust owner and group of /var/lib/prometheus directories.
chown -R prometheus:prometheus /var/lib/prometheusPrometheus zip file also contains a configuration file with default settings. We can use this file to configure our Prometheus server.
With the help of mv Linux command, move Prometheus configuration file to /etc/prometheus directory.
cd
mv /var/lib/prometheus/prometheus.yml /etc/prometheus/
Create a soft link of prometheus executable file, so we can execute the prometheus command from CLI.
ln -s /var/lib/prometheus/prometheus /usr/local/bin/prometheusTo setup autostart of Prometheus Server at the time of Linux startup, we need to create a Systemd service for Prometheus network monitoring tool as follows.
vi /usr/lib/systemd/system/prometheus.serviceAnd add following directives in that file.
[Unit]
Description=Prometheus
Wants=network-online.target
After=network-online.target

[Service]
User=prometheus
Group=prometheus
Type=simple
ExecStart=/usr/local/bin/prometheus
--config.file /etc/prometheus/prometheus.yml
--storage.tsdb.path /var/lib/prometheus/
--web.console.templates=/var/lib/prometheus/consoles
--web.console.libraries=/var/lib/prometheus/console_libraries

[Install]
WantedBy=multi-user.target
Enable and start Prometheus network service.
systemctl enable --now prometheus.servicePrometheus uses default service port 9090/tcp. We need to allow this port in Linux firewal, so the network traffic can reach to Prometheus server.
firewall-cmd --permanent --add-port=9090/tcp
firewall-cmd --reload
Open URL http://prometheus-01.example.com using a web browser.

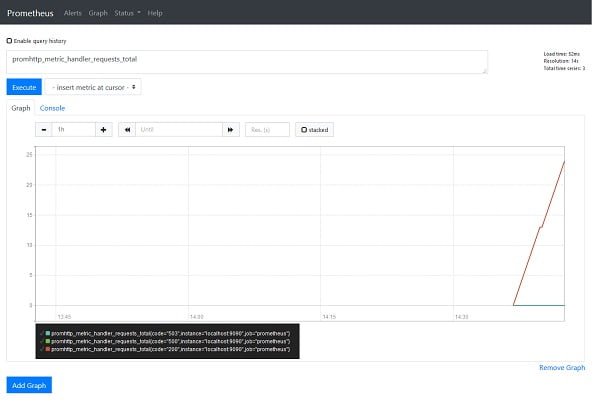
We are now at the Expression Browser web page. Here, we can search for the metrics, for which Prometheus is collecting data.
To see the graph of the data click on Graph.

Install Node_Exporter on CentOS 7
Prometheus receives metrics from many sources like machines, databases, applications, etc.
For this purpose, Prometheus requires an Agent (termed as Exporter) to be installed on each node, for which we want to collect metrics.
There are different types of exporters available at Prometheus website. We can download and use one, according to our requirement. But the most common Exporter that we prefer to install on each node to collect machine metrics is the node_exporter.
In this section, we are installing node_exporter on the same CentOS 7 based Prometheus event monitoring server.
Download Node_Exporter from it’s official download page.
cd /tmp
wget https://github.com/prometheus/node_exporter/releases/download/v0.18.1/node_exporter-0.18.1.linux-amd64.tar.gz
Extract downloaded files as follows.
tar xf node_exporter-0.18.1.linux-amd64.tar.gzCreate a directory for node_exporter software.
mkdir -p /var/lib/prometheus/node_exporterMove extracted files to /var/lib/prometheus/node_exporter directory.
mv node_exporter-0.18.1.linux-amd64/* /var/lib/prometheus/node_exporter
cd
Change ownership of node_exporter directory.
chown -R prometheus:prometheus /var/lib/prometheus/node_exporter/Create a systemd service for node_exporter, so it can be started automically during Linux server startup.
vi /usr/lib/systemd/system/node_exporter.serviceAdd following lines of code in this file.
[Unit]
Description=Node Exporter
Wants=network-online.target
After=network-online.target

[Service]
User=prometheus
ExecStart=/var/lib/prometheus/node_exporter/node_exporter

[Install]
WantedBy=default.target
Enable and start node_exporter service.
systemctl enable --now node_exporter.serviceNode Exporter used default service port 9100/tcp. Therefore, we need to allow this service port in Linux firewall.
firewall-cmd --permanent --add-port=9100/tcp
firewall-cmd --reload
Add a Node_Exporter Target in Prometheus Server
We have successfully installed node_exporter, now we have to add it as a target in Prometheus server.
Edit Prometheus configuration file.
vi /etc/prometheus/prometheus.ymland add following directives at the end of file.
  - job_name: 'node_exporter'
    static_configs:
    - targets: ['localhost:9100']
Restart Prometheus service to take changes into effect.
systemctl restart prometheus.serviceBrowse URL http://prometheus-01.example.com:9090/ and search for some node metrics there.
We are searching node_memory_MemAvailable_bytes metric here.

To see the graph of this metric click on Graph button.

Since, we have recently added this node to Prometheus Server, therefore, there isn’t much time series data available yet. Hence, we have adjusted time to 1m to fill the graph completely.
Read Also: How to install Grafana on CentOS 7
Frequently Asked Questions (FAQs)
1. What is Prometheus, and why is it used?
Prometheus is an open-source monitoring and alerting tool designed for collecting and analyzing metrics from systems, applications, and services. It is widely used for real-time monitoring, time-series data storage, and alerting in cloud and on-premise environments.
2. What are the system requirements to install Prometheus on CentOS 7?
To install Prometheus on CentOS 7, you need:
A 64-bit CentOS 7 server
At least 2 CPU cores and 2GB RAM (recommended)
Root or sudo privileges
Network access to fetch the installation files
3. How do I create a Prometheus system user for security?
For security reasons, it is recommended to create a dedicated system user for running Prometheus. This helps to restrict privileges and minimize risks in case of security vulnerabilities.
4. Where does Prometheus store its data?
Prometheus stores its time-series metrics in a local database by default, located in /var/lib/prometheus. You can also configure remote storage integrations for long-term metric retention.
5. How do I access the Prometheus web interface after installation?
Once Prometheus is installed and running, you can access its web-based UI by opening a browser and navigating to:
http://your-server-ip:9090
From there, you can run PromQL queries, monitor metrics, and configure alerting rules.
Final Thoughts
Installing Prometheus on CentOS 7 is a key step towards setting up a robust monitoring and alerting system for your infrastructure. With the right setup, Prometheus will help you track metrics, visualize data, and manage alerts effectively. Whether you’re a systems administrator or an IT professional, mastering Prometheus will enhance your monitoring capabilities and streamline your operations.
Whether you need cloud optimization, server management, or automation, I provide comprehensive AWS and Linux services. Hire me to elevate your systems.
Recommended Courses
If you’re serious about mastering infrastructure monitoring and alerting with Prometheus, I highly recommend checking out the course “Prometheus | The Complete Hands-On for Monitoring & Alerting” by A to Z Mentors.
This step-by-step training is perfect for system administrators, DevOps engineers, and cloud professionals who want practical, real-world skills to set up Prometheus, integrate alerting systems, and keep mission-critical applications running smoothly. It’s a valuable investment in your career growth and will help you stay ahead in the fast-moving DevOps world.
(Disclaimer: This page contains affiliate links. If you purchase through these links, I may earn a small commission at no extra cost to you.)

Leave a Reply
You must be logged in to post a comment.