Learn how to install Prometheus on CentOS 8 with this comprehensive guide. Follow our step-by-step instructions to set up and configure Prometheus for monitoring your system’s performance and metrics. #centlinux #linux #prometheus
Table of Contents
What is Prometheus?
Prometheus is an open-source systems monitoring and alerting toolkit originally developed by SoundCloud. It has since become a standalone open-source project and is maintained by the Cloud Native Computing Foundation (CNCF). Prometheus is designed for reliability and scalability, making it a popular choice for monitoring complex and dynamic environments, especially those that rely on microservices architecture.
The project is written in Go and licensed under the Apache 2 License, with source code available on GitHub, and is a graduated project of the Cloud Native Computing Foundation, along with Kubernetes and Envoy.
Key features of Prometheus include:
- Multi-dimensional Data Model: Prometheus stores all data as time series, identified by metric names and key/value pairs called labels. This model allows for flexible and powerful queries.
- Powerful Query Language (PromQL): Prometheus provides PromQL, a functional query language that allows users to select and aggregate time series data in real-time.
- Pull-Based Model: Prometheus scrapes metrics from instrumented targets, which allows it to collect data at regular intervals. This pull-based approach makes it easy to integrate with various services and systems.
- Service Discovery: Prometheus supports service discovery mechanisms to automatically find targets to scrape, including static configuration, DNS, and integrations with various orchestration systems like Kubernetes.
- Alerting: Prometheus has a built-in alerting mechanism with its Alertmanager component. It allows users to define alert rules based on Prometheus query results and send notifications via various channels like email, Slack, or custom webhooks.
- Visualization: Prometheus can generate basic visualizations of data. Additionally, it integrates well with Grafana, a popular open-source visualization tool, for creating more sophisticated dashboards.
- Self-Contained: Prometheus is designed to run standalone without external dependencies, making it easy to deploy and manage.
Prometheus is widely used for monitoring cloud-native applications, infrastructure, and more due to its robustness, flexibility, and scalability.

How to use Prometheus?
A typical monitoring platform with Prometheus is composed of multiple tools.
- Multiple exporters that typically run on the monitored host to export local metrics.
- Prometheus to centralize and store the metrics.
- Alertmanager to trigger alerts based on those metrics.
- Grafana to produce dashboards.
- PromQL is the query language used to create dashboards and alerts.
Prometheus Alternatives
There are several alternatives to Prometheus for monitoring and alerting in various environments. Each has its own strengths and weaknesses, catering to different use cases and preferences. Here are some popular Prometheus alternatives:
Grafana Loki
- Description: Loki is a log aggregation system designed to work seamlessly with Grafana. While it’s primarily for logs rather than metrics, it integrates well with Grafana for a comprehensive monitoring solution.
- Strengths: Tailored for logs, efficient storage, and querying of log data, integrates seamlessly with Grafana.
InfluxDB
- Description: A time-series database optimized for fast, high-availability storage and retrieval of time series data.
- Strengths: High performance, SQL-like query language (Flux), part of the TICK stack (Telegraf, InfluxDB, Chronograf, Kapacitor).
Graphite
- Description: A monitoring tool that stores numeric time-series data and renders graphs of this data on demand.
- Strengths: Simple design, well-established, good at handling large amounts of data, wide range of integrations.
Zabbix
- Description: An enterprise-level monitoring platform designed for monitoring and tracking the status of various network services, servers, and other network hardware.
- Strengths: Extensive out-of-the-box monitoring templates, robust alerting, strong SNMP support, good for infrastructure monitoring.
Nagios
- Description: One of the oldest and most established monitoring systems, primarily used for monitoring hosts, services, and network hardware.
- Strengths: Flexible, strong community support, numerous plugins and integrations, reliable alerting.
Datadog
- Description: A cloud-based monitoring and analytics platform for infrastructure, application performance, and log management.
- Strengths: Comprehensive monitoring capabilities, user-friendly interface, seamless integration with various cloud providers, powerful dashboarding and visualization tools.
Sensu
- Description: A monitoring system designed for monitoring servers, services, and application health across complex infrastructure.
- Strengths: Scalable, API-driven, strong support for event processing and custom checks, good for dynamic environments.
Sysdig
- Description: A monitoring and security platform designed for cloud-native environments, with deep visibility into containerized applications.
- Strengths: Strong container and Kubernetes support, detailed system call visibility, security features integrated with monitoring.
Elastic Stack (ELK)
- Description: Comprises Elasticsearch, Logstash, and Kibana, used for searching, analyzing, and visualizing log data in real-time.
- Strengths: Powerful full-text search, robust visualization capabilities with Kibana, wide range of data source integrations.
Each of these alternatives has its unique features and is suited for different monitoring requirements. The choice of tool depends on factors such as the complexity of the environment, specific monitoring needs, integration capabilities, and personal or organizational preferences.
Recommended Training: Prometheus | The Complete Hands-On for Monitoring & Alerting from Sean Bradley

Environment Specification
We are using a minimal RHEL 8 virtual machine with following specifications.
- CPU – 3.4 Ghz (2 cores)
- Memory – 2 GB
- Storage – 20 GB
- Operating System – Red Hat Enterprise Linux 8.4
- Hostname – prometheus-01.centlinux.com
- IP Address – 192.168.116.238 /24
Amazon Fire HD 8 tablet (newest model), 8” HD Display, 3GB memory, 32GB, designed for portable entertainment, Black
$54.99 (as of July 9, 2025 21:12 GMT +00:00 – More infoProduct prices and availability are accurate as of the date/time indicated and are subject to change. Any price and availability information displayed on [relevant Amazon Site(s), as applicable] at the time of purchase will apply to the purchase of this product.)Update your Linux Operating System
Connect with prometheus-01.centlinux.com as root user by using a ssh client.
Update your Linux operating system by using dnf command.
dnf update -yIf the above command updates your Linux Kernel, then reboot your Linux operating system with new Kernel.
rebootVerify the Linux operating system and Kernel versions, that are being used in this article.
cat /etc/redhat-release
uname -r
Output:
Red Hat Enterprise Linux release 8.4 (Ootpa)
4.18.0-305.12.1.el8_4.x86_64
Switch SELinux Target Policy to Permissive Mode
Prometheus currently does not includes an official SELinux policy. Therefore, your have to disable SELinux or switch it into permissive mode for proper functioning of your network monitoring software.
You can execute following commands at Linux Bash prompt to switch SELinux target policy to permissive mode.
sed -i 's/^SELINUX=.*/SELINUX=permissive/g' /etc/sysconfig/selinux
setenforce permissive
Create Prometheus User and Directories
Create a Linux user to own Prometheus software and processes.
useradd --no-create-home -s /bin/false prometheusCreate required Prometheus directories and adjust the ownership.
mkdir /etc/prometheus
mkdir /var/lib/prometheus
chown prometheus:prometheus /etc/prometheus
chown prometheus:prometheus /var/lib/prometheus
Install Prometheus on CentOS 8
You can free download systems monitoring tool from Prometheus official website.
You can use wget command to download Prometheus tarball directly from the Linux CLI. If you don’t have wget command, then install Prometheus on CentOS 8 by using dnf command.
wget https://github.com/prometheus/prometheus/releases/download/v2.29.2/prometheus-2.29.2.linux-amd64.tar.gz -P /tmpExtract the downloaded tarball into the /var/lib/prometheus directory.
tar -xf /tmp/prometheus-2.29.2.linux-amd64.tar.gz -C /var/lib/prometheus/ --strip-components=1Adjust the ownership of the extracted files.
chown -R prometheus:prometheus /var/lib/prometheusMove Prometheus configuration file to /etc/prometheus directory.
mv /var/lib/prometheus/prometheus.yml /etc/prometheus/Check the default configurations in prometheus.yml file.
grep -v '#' /etc/prometheus/prometheus.ymlOutput:
global:

alerting:
  alertmanagers:
    - static_configs:
        - targets:

rule_files:

scrape_configs:
  - job_name: "prometheus"


    static_configs:
      - targets: ["localhost:9090"]
Create symbolic links for Prometheus commands at /usr/bin directory to make them globally executable from any path.
cp -s /var/lib/prometheus/prometheus /usr/bin
cp -s /var/lib/prometheus/promtool /usr/bin
Gvyugke 2.4GHz Wireless Gaming Headsets for PS5, PS4, PC, Switch – Bluetooth 5.3 Gaming Headphones with Noise Canceling Mic, 7.1 Surround Sound, 70H Battery, Blue Lighting – Black
$33.97 (as of July 10, 2025 20:22 GMT +00:00 – More infoProduct prices and availability are accurate as of the date/time indicated and are subject to change. Any price and availability information displayed on [relevant Amazon Site(s), as applicable] at the time of purchase will apply to the purchase of this product.)Create Systemd Service Unit for Prometheus
To enable autostart of Prometheus server, you are required to create systemd service unit.
vi /usr/lib/systemd/system/prometheus.serviceAdd following directives in this file.
[Unit]
Description=Prometheus
Wants=network-online.target
After=network-online.target

[Service]
User=prometheus
Group=prometheus
Type=simple
ExecStart=/usr/bin/prometheus
--config.file /etc/prometheus/prometheus.yml
--storage.tsdb.path /var/lib/prometheus/
--web.console.templates=/var/lib/prometheus/consoles
--web.console.libraries=/var/lib/prometheus/console_libraries

[Install]
WantedBy=multi-user.target
Enable and start Prometheus service.
systemctl enable --now prometheus.serviceConfigure Linux Firewall
This network monitoring server uses default port 9090/tcp. Therefore, it is necessary to allow it Linux firewall to make it accessible accross the network.
firewall-cmd --permanent --add-port=9090/tcp
firewall-cmd --reload
Access Prometheus GUI
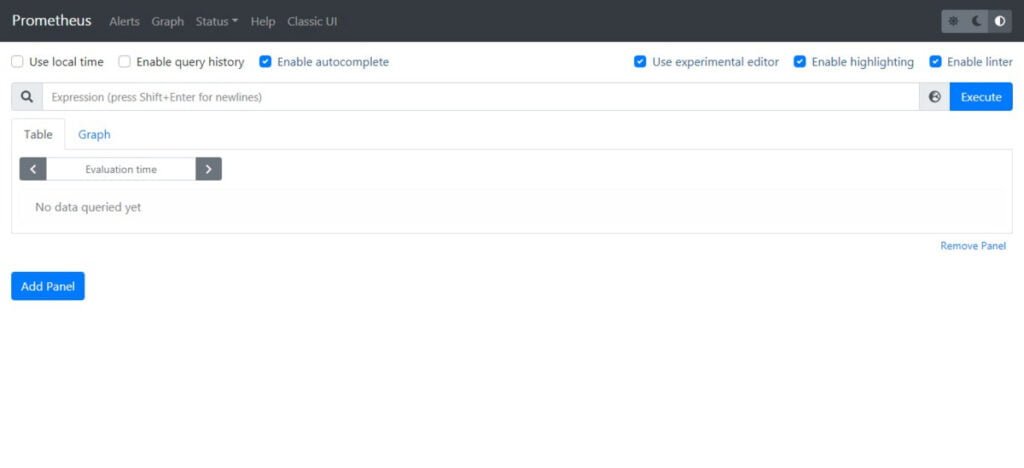
Open URL http://prometheus-01.centlinux.com in a web browser.

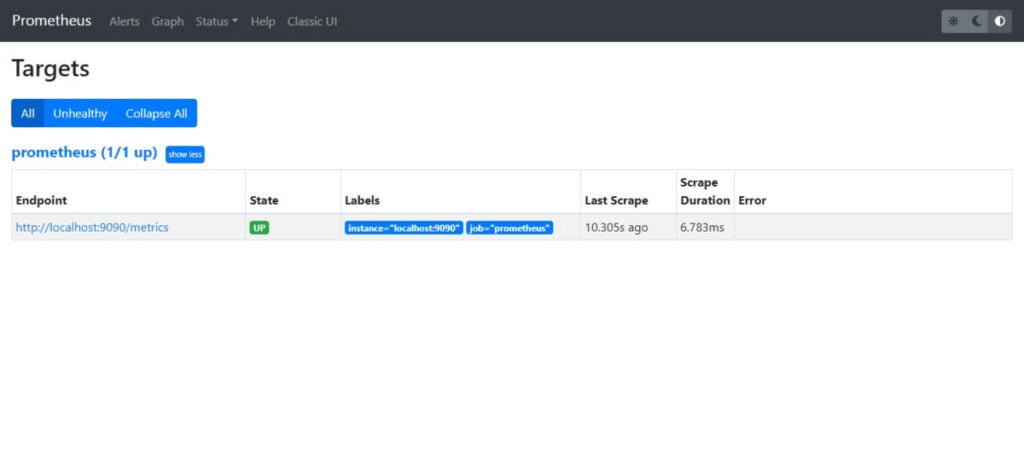
Open Status > Targets from top menu.

Install Node Exporter on CentOS 8
Node Exporter is a Prometheus exporter for server level and level metrics with configurable metric collectors. It helps us in measuring various server resources such as RAM, disk space, and CPU utilization.
You need to install node_exporter on your Prometheus server to gather metrics.
Create directory for Node Exporter software.
mkdir -p /var/lib/prometheus/node_exporterDownload Node Exporter tarball from Prometheus website.
wget https://github.com/prometheus/node_exporter/releases/download/v1.2.2/node_exporter-1.2.2.linux-amd64.tar.gz -P /tmpExtract downloaded tarball into /var/lib/prometheus/node_exporter/ directory.
tar xf /tmp/node_exporter-1.2.2.linux-amd64.tar.gz -C /var/lib/prometheus/node_exporter/ --strip-components=1Adjust directory ownership.
chown -R prometheus:prometheus /var/lib/prometheus/node_exporter/Create a symbolic link for node_exporter at /usr/bin directory.
cp -s /var/lib/prometheus/node_exporter/node_exporter /usr/bin/Enable autostart of node_exporter process, create a systemd service unit.
vi /usr/lib/systemd/system/node_exporter.serviceAdd following lines of code in this file.
[Unit]
Description=Node Exporter
Wants=network-online.target
After=network-online.target

[Service]
User=prometheus
ExecStart=/usr/bin/node_exporter

[Install]
WantedBy=default.target
Enable and start Node Exporter service.
systemctl enable --now node_exporter.serviceConfigure Linux firewall to allow node_exporter default port 9100/tcp.
firewall-cmd --permanent --add-port=9100/tcp
firewall-cmd --reload
Edit Prometheus configuration file in vim text editor.
vi /etc/prometheus/prometheus.ymlAdd the node_exporter endpoint configuration in this file.
 - job_name: 'node_exporter'
    static_configs:
    - targets: ['localhost:9100']
Restart Prometheus service to load new configurations.
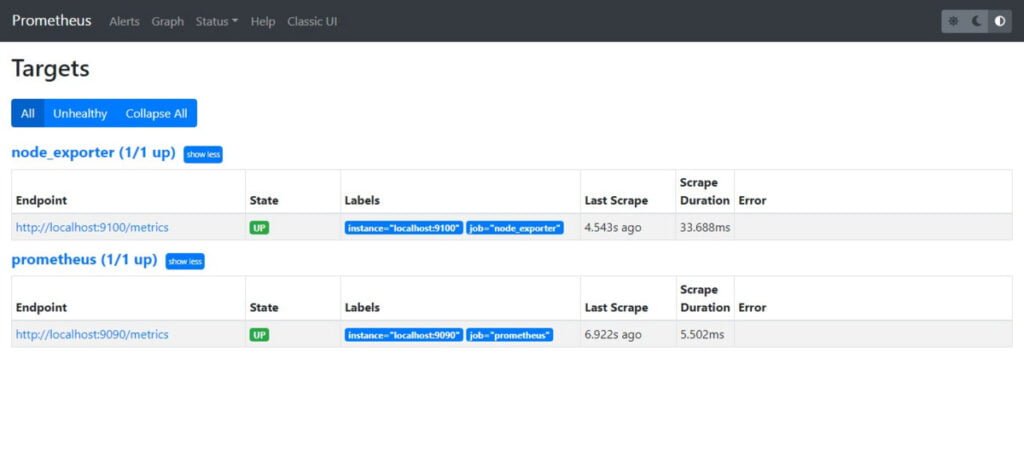
systemctl restart prometheus.serviceOpen Status > Targets or refresh the web page, if already opened.

Apple Pages User Manual: A Practical Guide for Students, Writers, and Professionals to Unlock the Full Power of Pages
$15.99 (as of July 10, 2025 21:22 GMT +00:00 – More infoProduct prices and availability are accurate as of the date/time indicated and are subject to change. Any price and availability information displayed on [relevant Amazon Site(s), as applicable] at the time of purchase will apply to the purchase of this product.)Frequently Asked Questions (FAQs)
1. How do I install and run Node Exporter?
Download the binary from the Prometheus website, extract it, and run ./node_exporter. By default, it exposes metrics on http://localhost:9100/metrics.
2. What are the key metrics exposed by Node Exporter?
Node Exporter provides system metrics like:
- CPU usage (
node_cpu_seconds_total) - Memory usage (
node_memory_MemAvailable_bytes) - Disk I/O (
node_disk_io_time_seconds_total) - Network stats (
node_network_receive_bytes_total)
3. How do I configure Prometheus to scrape Node Exporter?
Add this to prometheus.yml under scrape_configs:
   scrape_configs:
     - job_name: 'node_exporter'
       static_configs:
         - targets: ['localhost:9100']
Restart Prometheus to apply changes.
4. How does Prometheus scrape metrics?
Prometheus scrapes metrics from configured targets (like Node Exporter) at regular intervals via HTTP. The targets must expose metrics in Prometheus’ expected format.
5. How do I write a basic PromQL query?
A simple query like node_cpu_seconds_total retrieves CPU time metrics. Adding filters (e.g., node_cpu_seconds_total{mode="idle"}) refines results. Aggregations (e.g., sum()) help summarize data.
Final Thoughts
In conclusion, installing Prometheus on CentOS 8 is a straightforward process that involves downloading the Prometheus binary, configuring the system for optimal performance, and ensuring that the service starts automatically upon boot. By following the necessary steps—such as adding the Prometheus user, configuring the system firewall, and setting up the service file—Prometheus can be successfully installed and ready for monitoring your systems and applications.
With Prometheus running on CentOS 8, you gain powerful metrics collection and monitoring capabilities, making it easier to track system performance, troubleshoot issues, and ensure the health of your infrastructure. Whether you’re using Prometheus for a small setup or scaling it for a larger environment, its flexibility and integration with other tools like Grafana make it a valuable addition to your monitoring stack.
Your Linux servers deserve expert care! I provide reliable management and optimization services tailored to your needs. Discover how I can help on Fiverr!
Looking for a Linux server expert? I provide top-tier administration, performance tuning, and security solutions for your Linux systems. Explore my Fiverr profile for details!


Leave a Reply
You must be logged in to post a comment.