
kubectl top nodes failing? Get Kubernetes Metrics Server running in under 5 minutes. The production fix 90% of tutorials skip. #CentLinux #Kubernetes #DevOps
Table of Contents
Introduction
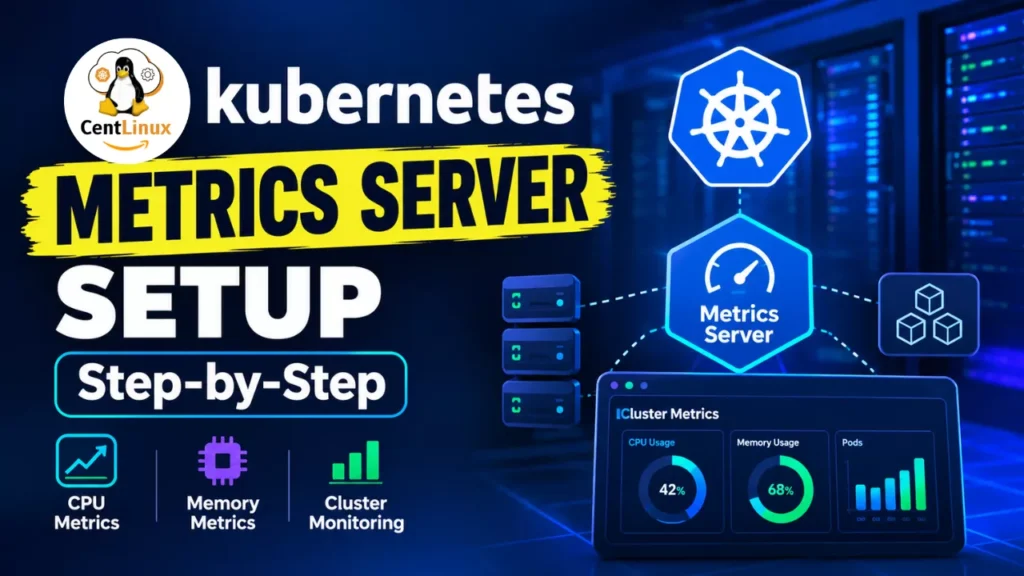
If you’ve ever tried to run kubectl top nodes and received an error, you know the frustration. The Kubernetes Metrics Server is one of those foundational components that every production cluster needs, yet its installation often trips up even experienced engineers. (Official website: https://kubernetes-sigs.github.io/metrics-server/)
The Metrics Server provides the Resource Metrics API (metrics.k8s.io), which powers essential functionality like Horizontal Pod Autoscaler (HPA), Vertical Pod Autoscaler (VPA), and the kubectl top commands . Without it, you’re flying blind on resource utilization.
In this guide, I’ll walk you through the exact commands I use to deploy the Kubernetes Metrics Server, explain the critical configuration that most tutorials miss, and share hard-earned lessons from years of experience in Linux and DevOps.
Prerequisites and Verification
Before touching the Metrics Server installation, verify your cluster is healthy and accessible.
Step 1: Confirm Cluster Connectivity
kubectl cluster-info
kubectl get nodes
Why this matters: These commands confirm that your kubeconfig is properly configured and that the control plane is reachable. kubectl cluster-info displays the endpoints for the API server, while kubectl get nodes shows whether worker nodes are in Ready state .
Pro Tip: If kubectl get nodes shows nodes as NotReady, fix that before proceeding. Metrics Server scrapes kubelet endpoints on each node—unhealthy nodes will cause partial metrics.
Step 2: Check Existing Metrics Availability
kubectl top nodesExpected outcome: If the Metrics Server is already deployed and functional, you’ll see CPU and memory usage. If not, you’ll receive an error like:
error: Metrics API not availableor
error: metrics not available yetThis error indicates the metrics.k8s.io API group isn’t registered—the exact problem this guide solves.
Installing the Kubernetes Metrics Server
Step 3: Download the Official Manifest
wget https://github.com/kubernetes-sigs/metrics-server/releases/latest/download/components.yamlWhy use the official manifest: The Kubernetes SIGs repository is the canonical source. It includes all necessary RBAC resources, the APIService registration, and the Deployment spec .
My Opinion: Always use the upstream manifest rather than third-party Helm charts unless your organization mandates Helm. The upstream components.yaml is transparent, auditable, and version-tagged. You know exactly what’s being deployed.
Step 4: Edit the Manifest (The Critical Step)
vi components.yamlLocate the metrics-server Deployment and find the args section under the container spec. Add this line:
- --kubelet-insecure-tlsThe complete args section should look like:
args:
  - --cert-dir=/tmp
  - --secure-port=10250
  - --kubelet-preferred-address-types=InternalIP,ExternalIP,Hostname
  - --kubelet-use-node-status-port
  - --metric-resolution=15s
  - --kubelet-insecure-tls
Why --kubelet-insecure-tls Is Necessary
This is the single most important configuration detail, and it’s where most installations fail.
The technical problem: Metrics Server communicates with each kubelet over HTTPS. The kubelet presents a certificate, but on most self-managed clusters (kubeadm, k3s, RKE2, bare-metal), that certificate is self-signed and doesn’t include the node’s IP address in its Subject Alternative Names (SANs) .
The error you’ll see without it:
x509: cannot validate certificate for <IP> because it doesn't contain any IP SANsThe --kubelet-insecure-tls flag tells Metrics Server to skip certificate verification when scraping kubelet endpoints .
Security Trade-off
The upstream documentation explicitly states this flag is “for testing purposes only” . Here’s my pragmatic take based on my experience:
Use --kubelet-insecure-tls when:
- Running on bare-metal, kubeadm, or self-managed clusters where kubelet certificates are self-signed
- Deploying in development, staging, or air-gapped environments
- You’ve accepted the internal network trust model
Avoid it when:
- Running on managed Kubernetes (EKS, AKS, GKE) where kubelet certificates are properly signed
- Your security posture requires full mutual TLS verification
- Compliance frameworks (PCI-DSS, HIPAA) mandate certificate validation
The Better Alternative: In production self-managed clusters, rotate kubelet certificates properly. It’s more setup work, but certificate validation remains intact .
Read Also: How to Create a Kubernetes Network Policy
Deploy and Verify
Step 5: Apply the Manifest
kubectl apply -f components.yamlExpected output:
serviceaccount/metrics-server created
clusterrole.rbac.authorization.k8s.io/system:aggregated-metrics-reader created
clusterrole.rbac.authorization.k8s.io/system:metrics-server created
rolebinding.rbac.authorization.k8s.io/metrics-server-auth-reader created
clusterrolebinding.rbac.authorization.k8s.io/metrics-server:system:auth-delegator created
clusterrolebinding.rbac.authorization.k8s.io/system:metrics-server created
service/metrics-server created
deployment.apps/metrics-server created
apiservice.apiregistration.k8s.io/v1beta1.metrics.k8s.io created
The APIService creation is the key indicator that the metrics.k8s.io API is being registered .
Step 6: Verify Pod Status
kubectl get pods -A | grep metrics-serverExpected output:
kube-system metrics-server-7b4f8c495f-xxxxx 1/1 Running 0 30sCritical: The READY column must show 1/1. If it shows 0/1, check the pod logs:
kubectl logs -n kube-system deployment/metrics-serverCommon failure modes:
- Missing
--kubelet-insecure-tls→ TLS handshake errors - Network policies blocking kubelet access
- MTU mismatches on cloud VMs
Step 7: Confirm Metrics Availability
kubectl top nodesFirst run: You may see error: metrics not available yet. Wait 30-60 seconds. Metrics Server needs a scrape cycle (default 15-second resolution) before data appears .
Second run:
NAME       CPU(cores)   CPU%   MEMORY(bytes)   MEMORY%
master     250m         12%    1024Mi          25%
worker-1   450m         22%    2048Mi          50%
worker-2   380m         19%    1536Mi          38%
Pro Tip: If metrics still don’t appear after 2 minutes, verify the APIService:
kubectl get apiservice v1beta1.metrics.k8s.ioThe AVAILABLE column should show True .
Read Also: Kubernetes Pod Tutorial for Beginners 2026
Production Best Practices
Resource Limits
The default manifest doesn’t set resource requests/limits. For production, add them:
resources:
  requests:
    cpu: 100m
    memory: 200Mi
  limits:
    cpu: 500m
    memory: 500Mi
High Availability
For critical clusters, run 2+ replicas:
spec:
  replicas: 2
Combined with PodDisruptionBudget and anti-affinity rules, this ensures metrics availability during node maintenance.
Monitoring the Metrics Server
Ironically, you should monitor Metrics Server itself. Key signals:
- Pod restarts
- API response latency
kubectl get --raw /apis/metrics.k8s.io/v1beta1response time
Troubleshooting Quick Reference
| Symptom | Likely Cause | Fix |
|---|---|---|
x509: certificate signed by unknown authority | Missing --kubelet-insecure-tls | Add the flag |
metrics not available yet | Insufficient wait time | Wait 60s |
connection refused to kubelet | Network policy / firewall | Allow port 10250 |
context deadline exceeded | MTU mismatch | Adjust MTU |
| Metrics work for pods but not nodes | Kubelet port mismatch | Check --kubelet-use-node-status-port |
Conclusion
The Kubernetes Metrics Server is non-negotiable for any cluster running HPA or requiring kubectl top visibility. The installation itself takes under two minutes—the complexity lies entirely in the --kubelet-insecure-tls decision.
My recommendation: Use it on self-managed clusters without hesitation. The internal network trust model is acceptable for most organizations. For managed Kubernetes or strict compliance environments, invest in proper certificate rotation.
Once deployed, verify with kubectl top nodes and start leveraging metrics for autoscaling decisions. Your cluster will thank you when traffic spikes and HPA responds automatically.
FAQs for Kubernetes Metrics Server
FAQ 1: What is the Kubernetes Metrics Server and why is it important?
Answer: The Kubernetes Metrics Server is a cluster-wide aggregator of resource usage data that collects CPU and memory metrics from every node and pod. It powers essential features like Horizontal Pod Autoscaler, Vertical Pod Autoscaler, and the kubectl top commands. Without it, your cluster operates blind—autoscaling decisions can’t be made, and you have no visibility into resource consumption. It’s a foundational component that every production cluster should have running.
FAQ 2: Is the Metrics Server included with Kubernetes by default?
Answer: No. Unlike core components such as the API server or kubelet, the Metrics Server is not bundled with Kubernetes distributions. It must be deployed separately as an add-on. This design choice gives operators flexibility to choose their monitoring stack, but it also means many newcomers are surprised when resource metrics aren’t available out of the box. Managed services like EKS, AKS, and GKE often provide it, but self-managed clusters require manual installation.
FAQ 3: What is the difference between Metrics Server and a full monitoring solution like Prometheus?
Answer: Metrics Server is lightweight and designed for a single purpose: providing real-time resource metrics to Kubernetes APIs for autoscaling and quick lookups. It stores only the most recent data points in memory and doesn’t persist history. Prometheus, by contrast, is a full time-series database built for long-term storage, complex queries, alerting, and dashboarding. Most organizations run both—Metrics Server for autoscaling, Prometheus for observability and historical analysis.
FAQ 4: Why do so many Metrics Server installations fail on self-managed clusters?
Answer: The most common failure is a TLS certificate validation error between Metrics Server and the kubelet. On self-managed clusters, kubelet certificates are typically self-signed and lack proper IP Subject Alternative Names. Metrics Server rejects these certificates by default, causing the installation to appear successful while metrics remain unavailable. This is why the --kubelet-insecure-tls flag exists—it’s a pragmatic workaround, though it comes with a security trade-off that operators must consciously accept.
FAQ 5: What happens to my cluster if the Metrics Server goes down?
Answer: Existing pods continue running unaffected, but autoscaling stops working. Horizontal Pod Autoscalers can no longer read current resource usage, so they freeze at their last known state and won’t scale up during traffic spikes. The kubectl top commands return errors, and any dashboards relying on the Resource Metrics API go dark. This is why running Metrics Server with multiple replicas and a PodDisruptionBudget is strongly recommended for production environments—a single point of failure here can cascade into capacity issues during peak demand.
Recommended Courses
If you’re eager to kickstart your journey into cloud-native technologies, “Kubernetes for the Absolute Beginners – Hands-on” by Mumshad Mannambeth is the perfect course for you. Designed for complete beginners, this course breaks down complex concepts into easy-to-follow, hands-on lessons that will get you comfortable deploying, managing, and scaling applications on Kubernetes.
Whether you’re a developer, sysadmin, or IT enthusiast, this course provides the practical skills needed to confidently work with Kubernetes in real-world scenarios. By enrolling through the links in this post, you also support this website at no extra cost to you.
Disclaimer: Some of the links in this post are affiliate links. This means I may earn a small commission if you make a purchase through these links, at no additional cost to you.






Leave a Reply
You must be logged in to post a comment.