Learn how to install Grafana dashboard on Rocky Linux 8. Follow our step-by-step guide to set up Grafana for monitoring and visualizing your system’s performance data effectively. #centlinux #linux #grafana
Table of Contents
What is Grafana?
Grafana is an open-source data visualization and monitoring tool that allows you to create and share dynamic dashboards. It is widely used for monitoring and analyzing system performance, infrastructure metrics, and application analytics. (Grafana Official Website)
Key features of Grafana include:
- Dashboard Creation: Grafana enables you to create comprehensive and customizable dashboards using a wide range of visualization options like graphs, charts, tables, heatmaps, and more.
- Data Source Integration: It supports a variety of data sources, including Prometheus, Graphite, Elasticsearch, InfluxDB, MySQL, PostgreSQL, and many others, allowing you to visualize data from multiple sources in one place.
- Alerting: Grafana allows you to set up alert rules for your metrics. When these rules are violated, Grafana can notify you via email, Slack, PagerDuty, and other notification channels.
- Templating: With templating, you can create reusable dashboard templates that can be customized with different variables, making it easy to apply consistent dashboards across different environments or data sources.
- Annotations: You can add annotations to your graphs to mark specific events, making it easier to correlate metric changes with events or incidents.
- User Management: Grafana offers user authentication and role-based access control, ensuring that only authorized users can view or edit dashboards.
- Plugins: Grafana has a rich ecosystem of plugins, including data source plugins, panel plugins, and app plugins, extending its capabilities and allowing for deeper integration with other tools and services.
- Community and Enterprise Support: While the open-source version is free, Grafana also offers an enterprise edition with additional features, support, and services for organizations.
Grafana is popular among DevOps teams, system administrators, and data analysts for its powerful visualization capabilities, ease of use, and flexibility in integrating with various data sources. It is commonly used alongside other monitoring tools like Prometheus for comprehensive system and application monitoring.

Kibana vs Grafana
Kibana and Grafana are both powerful tools used for data visualization and monitoring, but they serve slightly different purposes and have unique features. Here’s a comparison of Kibana vs. Grafana:
Kibana
Purpose:
- Designed primarily to work with Elasticsearch, a powerful search and analytics engine.
- Used for log and event data analysis, search, and visualizations.
Key Features:
- Elasticsearch Integration: Deep integration with Elasticsearch, making it ideal for searching, analyzing, and visualizing large volumes of log and event data.
- Visualization Types: Offers various visualizations like bar charts, line graphs, pie charts, heatmaps, and more, focused on data exploration and analysis.
- Dashboarding: Allows the creation of interactive dashboards to combine multiple visualizations for a comprehensive view of data.
- Machine Learning: Provides anomaly detection and machine learning capabilities for advanced data analysis.
- Search Capabilities: Strong focus on search and querying, leveraging Elasticsearch’s full-text search capabilities.
- Security and Alerts: Built-in features for security, access control, and alerting based on specific conditions.
Use Cases:
- Log management and analysis.
- Monitoring and troubleshooting application performance.
- Security analytics and threat hunting.
Grafana
Purpose:
- A general-purpose dashboard and visualization tool that integrates with various data sources.
- Often used for monitoring infrastructure and application performance metrics.
Key Features:
- Multi-Source Integration: Supports a wide range of data sources including Prometheus, InfluxDB, Graphite, Elasticsearch, MySQL, PostgreSQL, and more.
- Visualization Flexibility: Offers diverse visualization options like graphs, heatmaps, tables, and single stat panels, which are highly customizable.
- Alerting: Allows users to set up alert rules for their metrics and receive notifications via multiple channels like email, Slack, PagerDuty, and others.
- Templating: Supports dashboard templating for reusability and flexibility across different environments or data sets.
- Annotations: Users can add annotations to graphs to mark specific events, helping correlate metric changes with events.
- Plugins: Extensive plugin ecosystem for additional functionality, data source integration, and custom panels.
Use Cases:
- Infrastructure and application performance monitoring.
- Real-time data visualization and alerting.
- Combining data from various sources into unified dashboards.
Comparison Summary
- Integration: Kibana is tightly integrated with Elasticsearch, making it the best choice for users heavily invested in the Elastic Stack. Grafana, on the other hand, is more versatile in integrating with multiple data sources.
- Use Case Focus: Kibana excels in log management, search, and security analytics, while Grafana shines in monitoring time-series data and performance metrics across diverse data sources.
- Visualization and Customization: Both tools offer rich visualization options, but Grafana is often considered more flexible and user-friendly for creating highly customizable and interactive dashboards.
- Alerting: Grafana has robust built-in alerting capabilities for monitoring metrics, whereas Kibana’s alerting is integrated with Elastic Stack’s alerting features.
In summary, the choice between Kibana and Grafana depends on your specific needs and existing infrastructure. If you are primarily working with Elasticsearch and need advanced log analysis and search capabilities, Kibana is the better choice. If you need a flexible and powerful tool for monitoring a wide range of metrics from different sources, Grafana is likely the better option.
Environment Specification
We are using a minimal Rocky Linux 8 virtual machine with following specifications.
- CPU – 3.4 Ghz (2 cores)
- Memory – 2 GB
- Storage – 20 GB
- Operating System – Rocky Linux 8.5 (Green Obsidian)
- Hostname – grafana-01.centlinux.com
- IP Address – 192.168.116.129 /24
For setting up your Grafana dashboard environment, especially when experimenting with Linux servers, using a dedicated Home Lab can greatly enhance your learning and testing experience. I recommend considering a compact Mini PC, which offers powerful performance and energy efficiency for running Rocky Linux smoothly on your desk.
[Limited Time Mini PC Offers – Click and Save!]
Alternatively, a reliable VPS like Bluehost provides excellent remote server options, giving you flexibility without the need for physical hardware.
[Try Bluehost VPS Now – Perfect for Linux & DevOps Enthusiasts!]
Both options are ideal for testing Grafana setups and other server applications. If you’re interested, check out the Mini PCs and Bluehost VPS plans linked above to get started quickly with your own Linux Home Lab.
Disclaimer: Some of the links above are affiliate links. This means I may earn a small commission at no extra cost to you if you make a purchase through these links. Your support helps keep this blog running with free, high-quality Linux tutorials.
Update your Linux Server
Connect with grafana-01.centlinux.com as root user by using a ssh client.
Execute following command to build cache for installed yum repositories.
dnf makecacheAs a best practice, update software packages in your Linux operating system before installing Grafana server.
dnf update -yOutput:
Last metadata expiration check: 0:01:52 ago on Sun 20 Feb 2022 08:28:10 PM PKT.
Dependencies resolved.
Nothing to do.
Complete!
Our Linux server is already up-to-date. The result may vary on your operating system.
Check the Linux Kernel and operating system version, being used in this installation guide.
cat /etc/rocky-release
uname -r
Output:
Rocky Linux release 8.5 (Green Obsidian)
4.18.0-348.12.2.el8_5.x86_64
Add Grafana Yum Repository in Linux
Create a .repo file in /etc/yum.repos.d directory by using vim text editor.
vi /etc/yum.repos.d/grafana.repoAnd add following directives in that file.
[grafana]
name=grafana
baseurl=https://packages.grafana.com/oss/rpm
repo_gpgcheck=1
enabled=1
gpgcheck=1
gpgkey=https://packages.grafana.com/gpg.key
sslverify=1
sslcacert=/etc/pki/tls/certs/ca-bundle.crt
Build the cache for Grafana yum repository.
dnf makecacheOutput:
Rocky Linux 8 - AppStream                       1.6 kB/s | 4.8 kB     00:02
Rocky Linux 8 - BaseOS                          1.2 kB/s | 4.3 kB     00:03
Rocky Linux 8 - Extras                          1.6 kB/s | 3.5 kB     00:02
grafana                                         169  B/s | 454  B     00:02
grafana                                         1.3 kB/s | 1.7 kB     00:01
Importing GPG key 0x24098CB6:
 Userid     : "Grafana <info@grafana.com>"
 Fingerprint: 4E40 DDF6 D76E 284A 4A67 80E4 8C8C 34C5 2409 8CB6
 From       : https://packages.grafana.com/gpg.key
Is this ok [y/N]: y
grafana                                         682 kB/s | 8.1 MB     00:12
Metadata cache created.
Install Grafana Dashboard on Rocky Linux 8
Since, you have added the Grafana yum repository, you can now easily install this Open Source analytics tool by executing following dnf command.
dnf install -y grafanaAfter successful installation of Grafana server, enable and start the network service as follows.
systemctl enable --now grafana-serverCheck the status of Grafana service.
systemctl status grafana-serverOutput:
● grafana-server.service - Grafana instance
   Loaded: loaded (/usr/lib/systemd/system/grafana-server.service; disabled; ve>
   Active: active (running) since Sun 2022-02-20 20:41:22 PKT; 6s ago
     Docs: http://docs.grafana.org
 Main PID: 1999 (grafana-server)
    Tasks: 8 (limit: 5808)
   Memory: 110.5M
   CGroup: /system.slice/grafana-server.service
           └─1999 /usr/sbin/grafana-server --config=/etc/grafana/grafana.ini -->

Feb 20 20:41:22 grafana-01.centlinux.com grafana-server[1999]: logger=sqlstore >
Feb 20 20:41:22 grafana-01.centlinux.com grafana-server[1999]: logger=plugin.ma>
Feb 20 20:41:22 grafana-01.centlinux.com grafana-server[1999]: logger=plugin.fi>
Feb 20 20:41:22 grafana-01.centlinux.com systemd[1]: Started Grafana instance.
Feb 20 20:41:22 grafana-01.centlinux.com grafana-server[1999]: logger=http.serv>
Configure Linux Firewall
To make your Grafana server accessible across the network, you have to allow it in your Linux firewall.
firewall-cmd --permanent --add-service=grafana
firewall-cmd --reload
Access Grafana Server
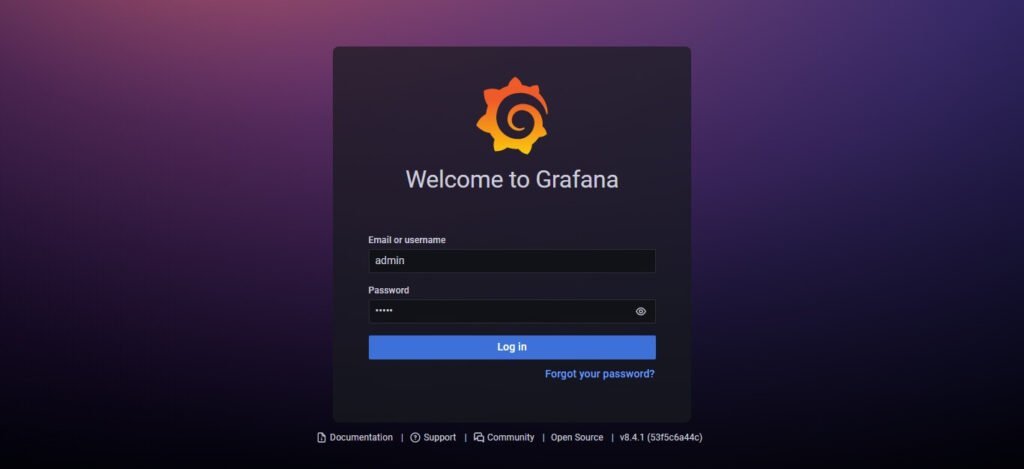
Open URL http://grafana-01.centlinux.com:3000/login in a web browser.

Login by using default Grafana username/password i.e. admin/admin

Set a new strong password for your Grafana admin user.

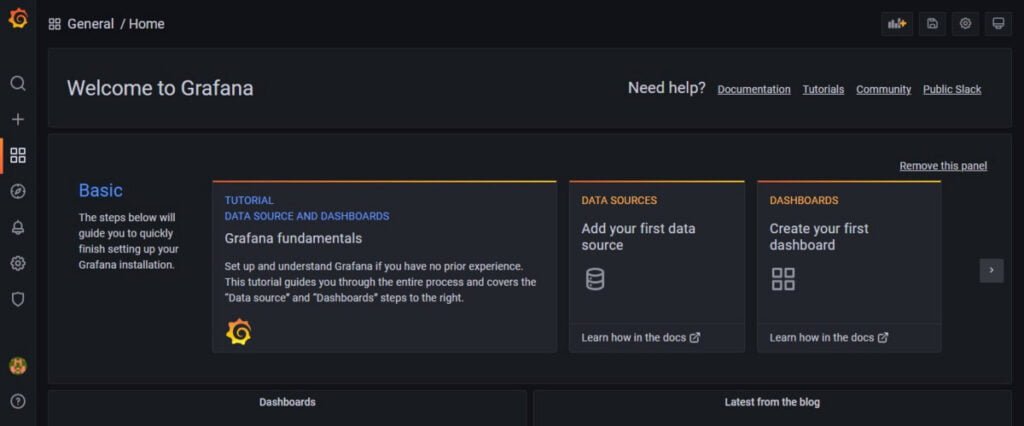
You have successfully login to Grafana web application.
Frequently Asked Questions (FAQs)
1. Is Grafana free to use?
Yes! Grafana is open-source and free to use with its core features. Grafana Cloud and Enterprise versions offer additional paid features like advanced support, enhanced security, and team collaboration tools.
2. How do I create a new dashboard in Grafana?
Click the “Create” (➕) button in the sidebar, then select “Dashboard.” You can add panels, configure data sources, and customize visualizations.
3. What data sources can Grafana connect to?
Grafana supports many data sources, including Prometheus, InfluxDB, MySQL, PostgreSQL, Elasticsearch, Loki, and cloud services like AWS CloudWatch and Google BigQuery.
4. How do I share or export a Grafana dashboard?
Go to the dashboard, click the Share (↗️) button, and choose between:
- Exporting as JSON (for backup or sharing)
- Generating a public link (if enabled)
- Publishing to Grafana.com (for community sharing)
5. Can I set up alerts in Grafana?
Yes! Grafana supports alert rules based on metric conditions. Go to a panel, click “Alert” and define thresholds to trigger notifications via email, Slack, or other integrations.
Final Thoughts
Installing Grafana on Rocky Linux 8 enables you to leverage a powerful and versatile tool for monitoring and visualizing system performance and application metrics. By following this guide, you successfully installed Grafana, configured its repository, started its service, and enabled it in the Linux firewall to make the dashboards accessible over the network.
Grafana’s intuitive user interface allows you to create and customize dashboards, integrate data sources, and monitor your infrastructure with precision. Whether you’re managing servers, applications, or networks, Grafana provides valuable insights to help you make informed decisions.
For a seamless experience, ensure that Grafana is regularly updated to the latest version and consider enhancing security by using SSL/TLS certificates.
Looking for a Linux server expert? I provide top-tier administration, performance tuning, and security solutions for your Linux systems. Explore my Freelancer profile for details!
Recommended Courses
If you’re looking to master modern monitoring and observability, the “Observability with Grafana, Prometheus, Loki, Alloy, and Tempo” by Aref Karimi is a highly practical online course that guides you through building a complete observability stack from scratch. Whether you’re a DevOps engineer, cloud professional, or system administrator, this course will help you gain hands-on expertise in metrics, logs, and traces using industry-leading tools. It’s an excellent investment to boost your career and stay ahead in today’s cloud-native world.
Disclaimer: This post contains affiliate links. If you purchase through these links, I may earn a small commission at no extra cost to you.

Leave a Reply
You must be logged in to post a comment.