Learn how to install Grafana on CentOS 7 with our detailed step-by-step guide. Set up Grafana for advanced data visualization and monitoring of your systems. #centlinux #linux #prometheus #grafana
Table of Contents
What is Prometheus?
Prometheus is a free and open source software application used for event monitoring and alerting. It collects and records real-time metrics in a time series database and alert the users based on custom defined thresholds. Prometheus is written in Go programming language and distributed under Apache License 2.0.
Although Prometheus is very good at collection, alerting and searching for metrics. But it does not include a native tool for creating custom dashboards. Although, we can create custom dashboards for the metrics collected by Prometheus by using another free and open source software i.e. Grafana.
In this article, we are creating a powerful network monitoring tool on CentOS 7 by using Grafana dashboard and Prometheus network monitoring software.
What is Grafana?
Grafana is a free and open-source, general-purpose graph and dashboard composer. It supports many third party software applications such as Prometheus, PNP, InfluxDB, Graphite, etc. Grafana runs as a web application at default port 3000/tcp.
In this article, we are installing Grafana and Prometheus on CentOS 7. And we will use Grafana Web UI to create a dashboard for Prometheus metrics.
Recommended Training for you: Grafana and Prometheus – Beginners Friendly Crash Course!

Read Also: How to install Grafana on Rocky Linux 9
Environment Specification
We are using the same CentOS 7 virtual machine on which we have installed Prometheus in our previous article.
- CPU – 3.4 Ghz (2 cores)
- Memory – 2 GB
- Storage – 20 GB
- Operating System – CentOS 7.7
- Hostname – prometheus-01.example.com
- IP Address – 192.168.116.213 /24
Install Grafana Yum Repository
Connect with prometheus-01.example.com using ssh as root user.
Grafana is available to downloads in many formats for a variety of Linux distros. Since, we are working on a CentOS 7 based Linux server, therefore, we can install Grafana by using RPMs.
Moreover, we can also install Grafana by using it’s official yum repository. Therefore, we are adding Grafana yum repository in our Linux server as follows.
# vi /etc/yum.repos.d/grafana.repo
and add following directives therein.
[grafana]
name=grafana
baseurl=https://packages.grafana.com/oss/rpm
repo_gpgcheck=1
enabled=1
gpgcheck=1
gpgkey=https://packages.grafana.com/gpg.key
sslverify=1
sslcacert=/etc/pki/tls/certs/ca-bundle.crt
Build cache for yum repositories.
# yum makecache fast
Install Grafana on CentOS 7
Now, we can install Grafana with the help of yum command.
# yum install -y grafana
Enable and start Grafana service.
# systemctl enable --now grafana-server.service
Created symlink from /etc/systemd/system/multi-user.target.wants/grafana-server.service to /usr/lib/systemd/system/grafana-server.service.
Allow Grafana default service port i.e. 3000/tcp in Linux firewall.
# firewall-cmd --permanent --add-port=3000/tcp
success
# firewall-cmd --reload
success
Open URL http://prometheus-01.example.com:3000/ in a web browser.

The default user/password for Grafana is admin/admin.

Because, we are login for the first time, therefore, Grafana prompt us to change the default password of admin user.
Add Prometheus Data Source in Grafana
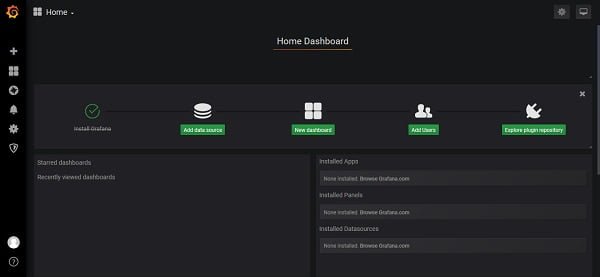
After successful login, we are now at the main screen of Grafana Web UI.
Click on Add Data Source.
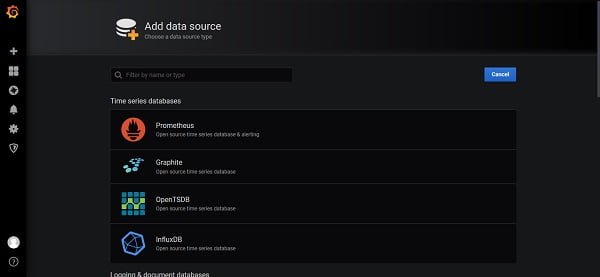
Click on Prometheus.
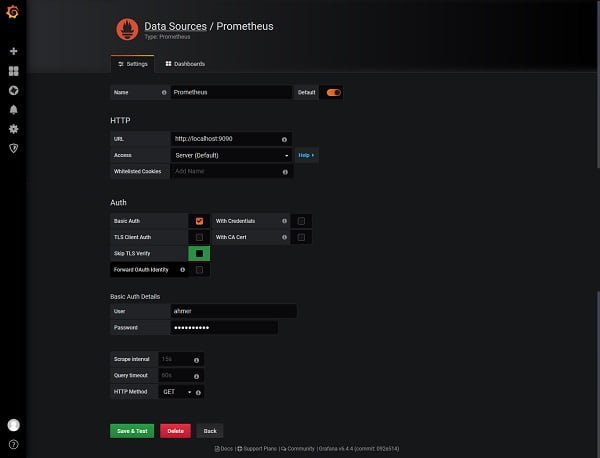
Add a Prometheus data source as we have added in the above screenshot.
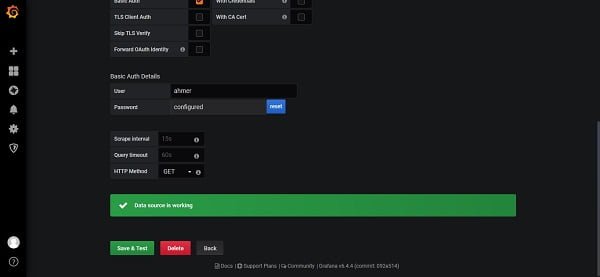
Click on Save and Test.
Create Prometheus Dashboard in Grafana
Now, to add a dashboard for Prometheus, click on Dashboards tab.
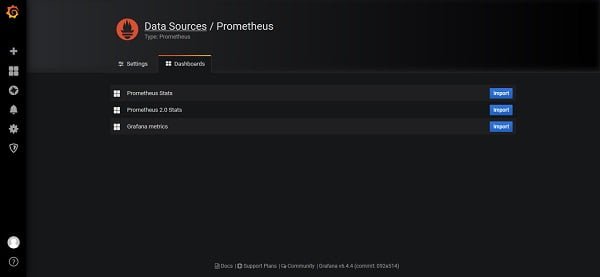
Here, you can see the available dashboards related to Prometheus data source.
Import a dashboard by clicking on the import button.
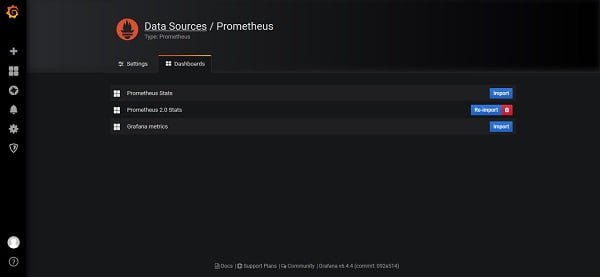
To customize this dashboard, click on Dashboards > Manage button from the left sidebar.
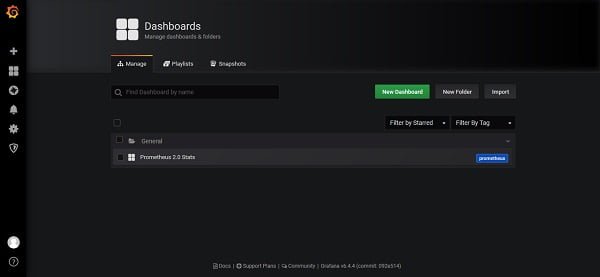
Click on the Prometheus 2.0 Stats dashboard.
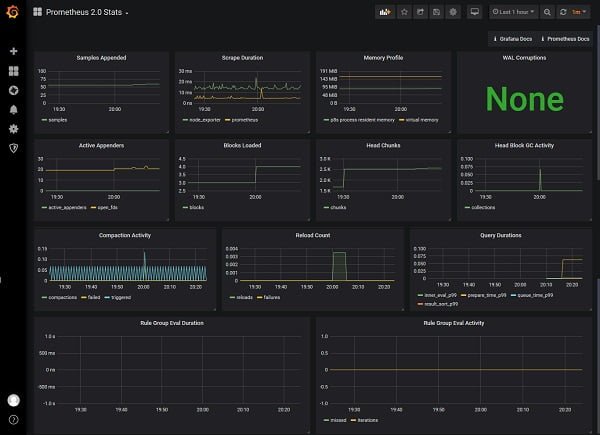
Customize this dashboard according to your requirements.
Create Alerts in Grafana
Click on Alerting > Notification Channels from the left sidebar.
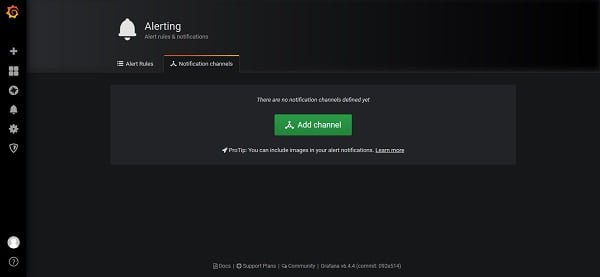
Click on Add Channel to add a notification channel.
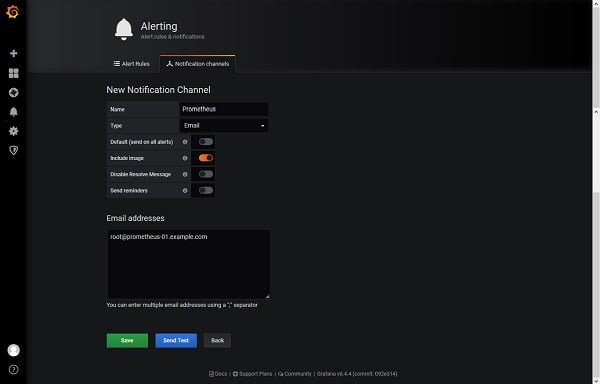
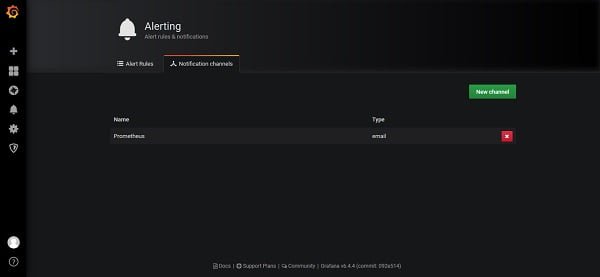
Add a channel as per the above screenshot.
Now click on Dashboards > Manage > Prometheus 2.0 Stats.
Click on Bell icon (Alert) button on left side of the page.
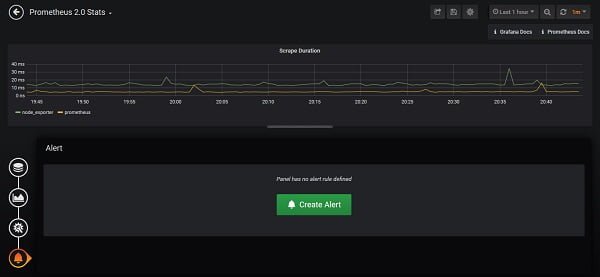
Click on Create Alert.
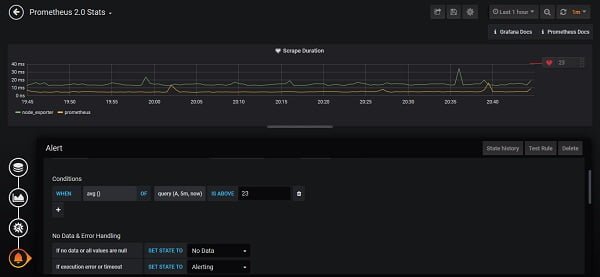
After editing, click on Save button on top menu bar.
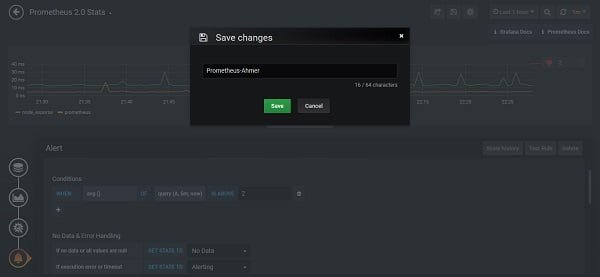
We have successfully installed Grafana and Prometheus on CentOS 7 and created a dashboard and alert for Prometheus metrics.
Prometheus: Up & Running (PAID LINK) by O’Reilly Media is a recommended book for the Linux system administrators, who want to learn more about creating dashboards in Grafana for Prometheus metrics.
Final Thoughts
Installing Grafana on CentOS 7 opens the door to powerful data visualization and monitoring for your systems. With Grafana, you can create insightful dashboards and gain valuable insights into your data. Whether you’re a system administrator or a data analyst, mastering Grafana will enhance your ability to monitor and analyze your infrastructure effectively.
If you need professional assistance or a more detailed guide to install Grafana on CentOS 7, I offer expert services on Fiverr. Visit my Fiverr profile: Red hat Certified Engineer to get personalized support and ensure a smooth and successful Grafana installation.