Learn how to install Grafana on CentOS 7 with our detailed step-by-step guide. Set up Grafana for advanced data visualization and monitoring of your systems. #centlinux #linux #prometheus #grafana
Table of Contents
What is Prometheus?
Prometheus is a free and open source software application used for event monitoring and alerting. It collects and records real-time metrics in a time series database and alert the users based on custom defined thresholds. Prometheus is written in Go programming language and distributed under Apache License 2.0.
Although Prometheus is very good at collection, alerting and searching for metrics. But it does not include a native tool for creating custom dashboards. Although, we can create custom dashboards for the metrics collected by Prometheus by using another free and open source software i.e. Grafana.
In this article, we are creating a powerful network monitoring tool on CentOS 7 by using Grafana dashboard and Prometheus network monitoring software.
What is Grafana?
Grafana is a free and open-source, general-purpose graph and dashboard composer. It supports many third party software applications such as Prometheus, PNP, InfluxDB, Graphite, etc. Grafana runs as a web application at default port 3000/tcp.
Read Also: How to install Grafana on Rocky Linux 9
In this article, we are installing Grafana and Prometheus on CentOS 7. And we will use Grafana Web UI to create a dashboard for Prometheus metrics.
Environment Specification
For this tutorial, we are utilizing the same CentOS 7 virtual machine where we previously installed Prometheus, as documented in our earlier article. This setup ensures a seamless integration between Prometheus and Grafana, allowing us to visualize and analyze the collected metrics efficiently.
By using the existing virtual machine, we eliminate the need for additional system configuration, making it easier to set up Grafana as a monitoring and visualization tool. This approach also helps in reducing resource overhead, ensuring that both Prometheus and Grafana run smoothly on a single instance.
Since Prometheus is already collecting system metrics, we can directly configure Grafana to use Prometheus as a data source, enabling real-time monitoring with visually appealing graphs and dashboards.
- CPU – 3.4 Ghz (2 cores)
- Memory – 2 GB
- Storage – 20 GB
- Operating System – CentOS 7.7
- Hostname – prometheus-01.example.com
- IP Address – 192.168.116.213 /24
To ensure optimal performance while installing and running Grafana on CentOS 7, a reliable server environment is crucial. For those setting up a dedicated monitoring server, the Apple 2024 Mac Mini PC is a top-rated server chassis that offers excellent cooling, expandability, and robust hardware compatibility, perfect for demanding Grafana workloads.
Additionally, pairing it with the Seagate IronWolf NAS Hard Drive provides reliable storage optimized for continuous data logging and monitoring environments. These products are highly trusted by professionals and make excellent additions to any monitoring setup.
Disclaimer: As an Amazon Associate, this site earns from qualifying purchases, which helps support ongoing content creation at no extra cost to you.
Install Grafana Yum Repository
To begin the Grafana installation on our CentOS 7 server, we first need to establish a secure SSH connection to the system where Prometheus is already installed. We will connect to our monitoring server, prometheus-01.example.com, as the root user using SSH.
Grafana is available for download in multiple formats, catering to a wide range of Linux distributions. Since we are working with a CentOS 7-based server, we have a couple of installation options:
- Using RPM Packages: Grafana provides pre-built RPM packages that can be manually downloaded and installed. This method is useful if we prefer to keep a local copy of the package for offline installation.
- Using the Official Yum Repository: The recommended approach for CentOS 7 is to add Grafana’s official YUM repository. This method ensures that we get the latest stable version, and it simplifies package management by allowing us to install, update, or remove Grafana using the standard yum package manager.
To proceed with the installation, we will first configure the Grafana YUM repository on our Linux server. This will enable us to install and manage Grafana efficiently, ensuring that we receive automatic updates whenever a new version is released.
vi /etc/yum.repos.d/grafana.repoand add following directives therein.
[grafana]
name=grafana
baseurl=https://packages.grafana.com/oss/rpm
repo_gpgcheck=1
enabled=1
gpgcheck=1
gpgkey=https://packages.grafana.com/gpg.key
sslverify=1
sslcacert=/etc/pki/tls/certs/ca-bundle.crt
Build cache for yum repositories.
yum makecache fastInstall Grafana on CentOS 7
Now, we can install Grafana with the help of yum command.
yum install -y grafanaEnable and start Grafana service.
systemctl enable --now grafana-server.serviceAllow Grafana default service port i.e. 3000/tcp in Linux firewall.
firewall-cmd --permanent --add-port=3000/tcp
firewall-cmd --reload
Open URL http://prometheus-01.example.com:3000/ in a web browser.

The default user/password for Grafana is admin/admin.

Because, we are login for the first time, therefore, Grafana prompt us to change the default password of admin user.
Add Prometheus Data Source in Grafana
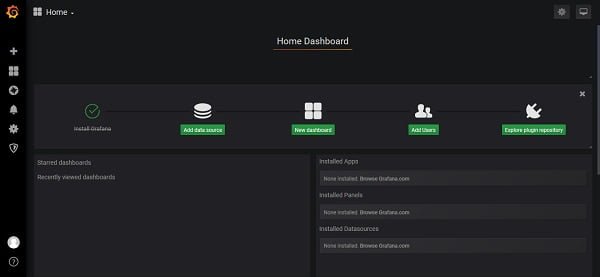
After successfully logging into the Grafana Web UI, you will be directed to the main dashboard interface. This is the central hub where you can manage data sources, create dashboards, configure alerts, and explore various visualization options.
To start using Grafana for monitoring and visualization, we need to connect it to a data source that provides the required metrics. Grafana supports multiple data sources such as Prometheus, InfluxDB, MySQL, Elasticsearch, and Loki.
To proceed, navigate to the left-hand menu and click on “Configuration” > “Data Sources”. Then, click on the “Add Data Source” button to begin the process of integrating a monitoring backend with Grafana. This will allow Grafana to retrieve and display real-time data in interactive graphs and dashboards.
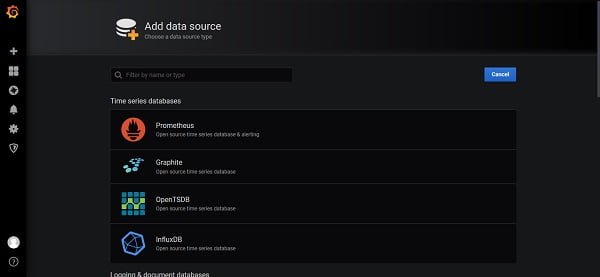
Click on Prometheus.
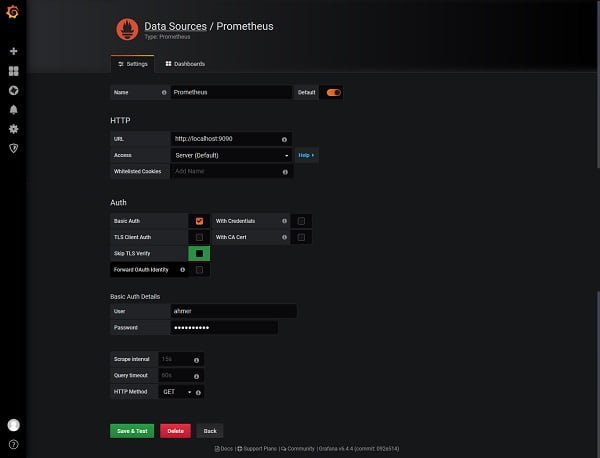
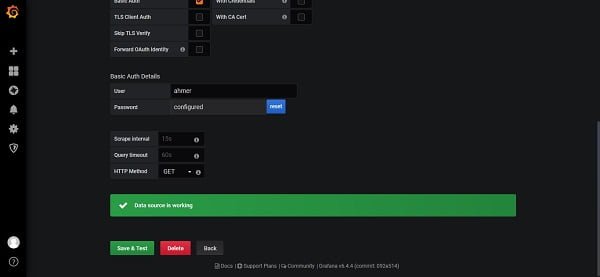
Add a Prometheus data source as we have added in the above screenshot.
Click on Save and Test.
Create Prometheus Dashboard in Grafana
Now, to add a dashboard for Prometheus, click on Dashboards tab.
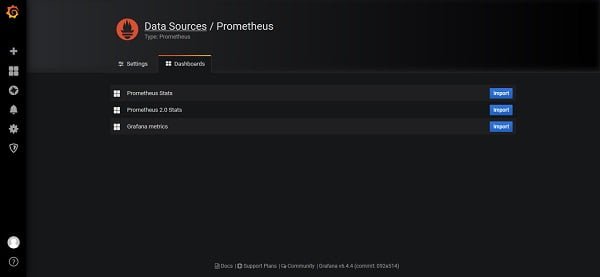
On this screen, you will see a list of available dashboards that are specifically designed for use with the Prometheus data source. These dashboards contain pre-configured panels that visualize key system metrics such as CPU usage, memory consumption, disk activity, and network performance.
Grafana allows you to import existing dashboards from its official dashboard repository, or you can use a custom JSON file containing dashboard configurations. This saves time and effort by providing ready-to-use visualizations instead of creating dashboards manually from scratch.
To import a dashboard, simply click on the “Import” button. You will then be prompted to either upload a JSON file or enter a Grafana.com dashboard ID to fetch the template directly from the Grafana community dashboards library. After importing, you can further customize the dashboard to match your specific monitoring requirements.
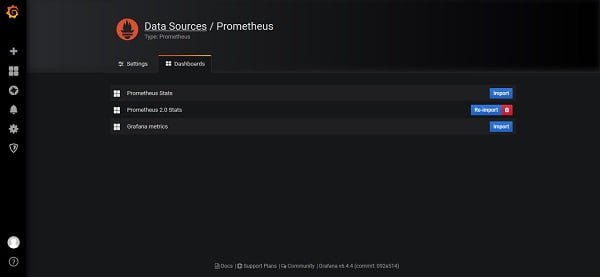
To customize this dashboard, click on Dashboards > Manage button from the left sidebar.
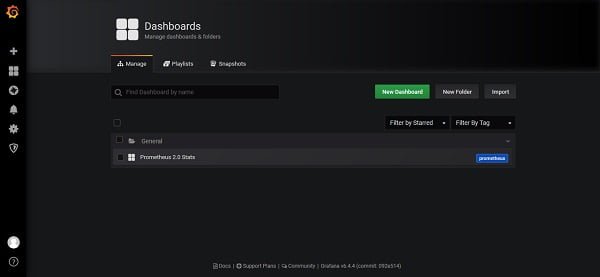
Click on the Prometheus 2.0 Stats dashboard.
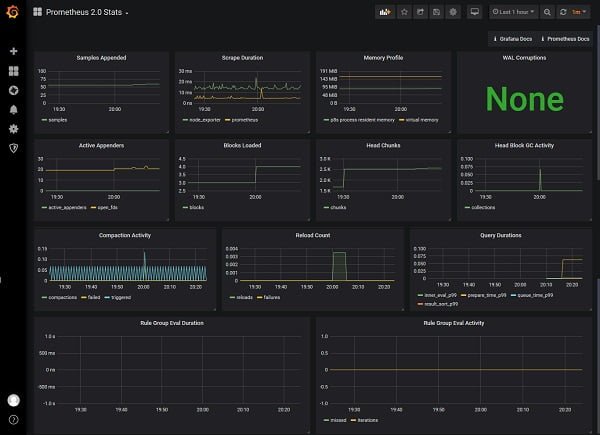
Customize this dashboard according to your requirements.
Create Alerts in Grafana
Click on Alerting > Notification Channels from the left sidebar.
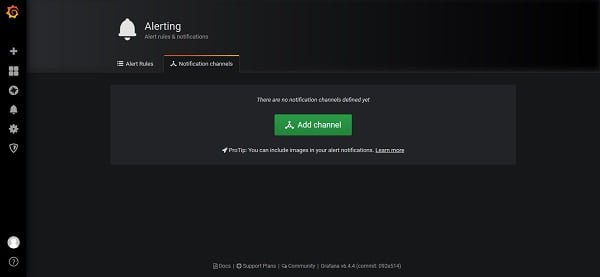
Click on Add Channel to add a notification channel.
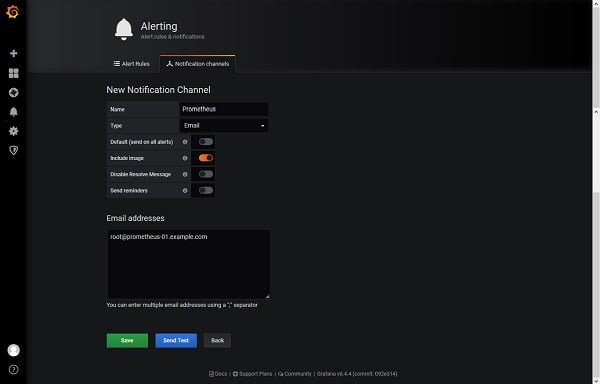
Add a channel as per the above screenshot.
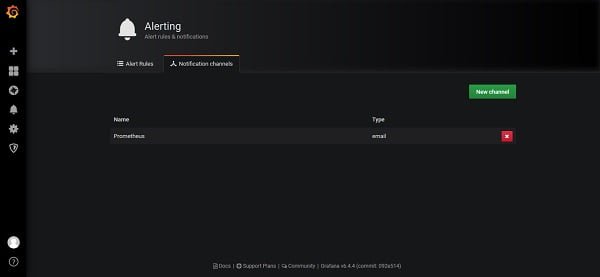
Now, navigate to the Dashboards section by clicking on “Dashboards” > “Manage”, and then select “Prometheus 2.0 Stats” from the list of available dashboards. This dashboard provides real-time monitoring insights based on data collected by Prometheus, including key performance metrics such as CPU load, memory usage, disk activity, and network traffic.
To configure alerts for proactive monitoring, look at the left-hand menu and locate the Bell icon (Alert). Click on this icon to access the alerting system, where you can define alert rules, thresholds, and notification settings. By setting up alerts, Grafana can automatically notify you via email, Slack, or other integrations whenever specific conditions are met, helping you respond quickly to system anomalies.
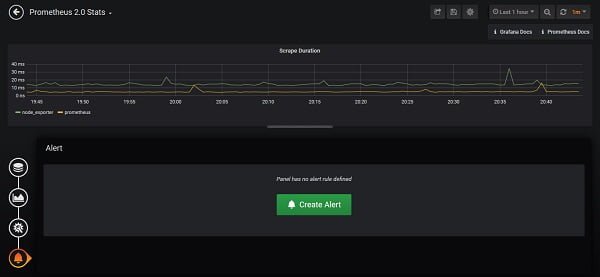
Click on Create Alert.
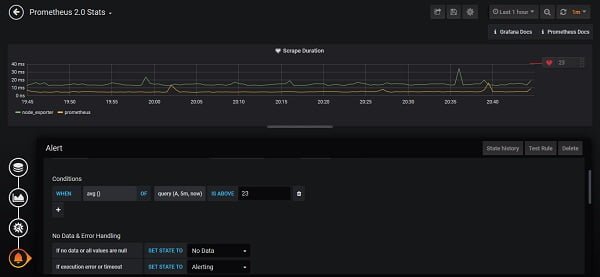
After editing, click on Save button on top menu bar.
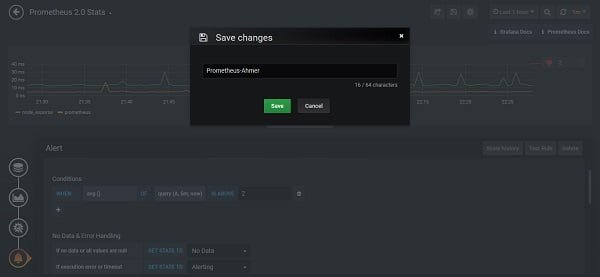
We have successfully installed Grafana and Prometheus on CentOS 7 and created a dashboard and alert for Prometheus metrics.
Frequently Asked Questions (FAQs)
1. What is Grafana, and why is it used?
Grafana is an open-source data visualization and monitoring tool used to create interactive dashboards for metrics from various data sources like Prometheus, InfluxDB, MySQL, and Elasticsearch.
2. What are the prerequisites for installing Grafana on CentOS 7?
Before installing Grafana, ensure that your system has CentOS 7, a stable network connection, root or sudo access, and optionally, a data source like Prometheus or InfluxDB for monitoring.
3. How do I access the Grafana web interface after installation?
Once installed and started, you can access Grafana by opening a web browser and navigating to http://<server-ip>:3000. The default login credentials are admin/admin.
4. Can I secure Grafana with SSL/TLS on CentOS 7?
Yes, Grafana supports HTTPS encryption. You can secure it using Let’s Encrypt SSL certificates, reverse proxy configurations with NGINX or Apache, or manually configuring TLS settings.
5. How do I add a data source to Grafana?
To add a data source, log in to Grafana, go to Configuration > Data Sources, select your preferred database (e.g., Prometheus, InfluxDB, MySQL), enter the connection details, and save the settings.
Final Thoughts
Installing Grafana on CentOS 7 opens the door to powerful data visualization and monitoring for your systems. With Grafana, you can create insightful dashboards and gain valuable insights into your data. Whether you’re a system administrator or a data analyst, mastering Grafana will enhance your ability to monitor and analyze your infrastructure effectively.
Need a dependable Linux system administrator? I specialize in managing, optimizing, and securing Linux servers to keep your operations running flawlessly. Check out my services!
Recommended Courses
If you’re looking to master modern monitoring and observability, the “Observability with Grafana, Prometheus, Loki, Alloy, and Tempo” by Aref Karimi is a highly practical online course that guides you through building a complete observability stack from scratch. Whether you’re a DevOps engineer, cloud professional, or system administrator, this course will help you gain hands-on expertise in metrics, logs, and traces using industry-leading tools. It’s an excellent investment to boost your career and stay ahead in today’s cloud-native world.
Disclaimer: This post contains affiliate links. If you purchase through these links, I may earn a small commission at no extra cost to you.

Leave a Reply
You must be logged in to post a comment.