Learn how to setup Elastic Stack on CentOS 7 with our comprehensive guide. Follow step-by-step instructions to install and configure Elasticsearch, Logstash, Kibana, and Beats for efficient log management and data analysis. #centlinux #linux #elasticsearch
Table of Contents
What is Elastic Stack?
Elastic Stack (formerly ELK Stack) is a popular Log Analytics solution consists of three open source software components i.e. Elasticsearch, Logstash and Kibana. Elastic Stack is available as a Software, a Docker based Container as well as a Service by many Cloud service providers like AWS and others.
Elasticsearch is a search engine based on Lucene library. Elasticsearch is a distributed, multitenant-capable, full-text search engine with a HTTP web interface and schema-free JSON documents.
Logstash is a server-side data processing pipeline that receives data from multiple sources simultaneously, transform it and then send it to Elasticsearch.
Kibana is an open source data visualization plugin for Elasticsearch. It provides visualization capabilities on top of the content indexed on an Elasticsearch cluster. User can create bar, line and scatter plots, or pie charts and maps on top of large volume of data.

Elastic Stack Features
Some of the features of Elastic Stack are:
- Clustering and high availability
- Automatic data rebalancing
- Horizontal scalability
- Full stack monitoring
- Index lifecycle management
- Encrypted communication
- Role based access control
Use Cases of Elastic Stack
The Elastic Stack has a wide range of use cases across various industries due to its powerful data collection, processing, and visualization capabilities. Some of the key use cases include:
Log Management and Analysis:
- Collect and centralize log data from various sources.
- Analyze log patterns to detect and troubleshoot issues.
- Monitor system and application performance.
Security Information and Event Management (SIEM):
- Detect and investigate security threats.
- Monitor and analyze security events in real-time.
- Conduct forensic analysis and compliance reporting.
Operational Analytics:
- Gain insights into IT infrastructure performance.
- Monitor system metrics and application performance.
- Track and analyze key performance indicators (KPIs).
Application Performance Monitoring (APM):
- Monitor application performance and availability.
- Identify and diagnose performance bottlenecks.
- Analyze user behavior and usage patterns.
Business Analytics:
- Collect and analyze business data for strategic insights.
- Monitor sales, marketing, and customer behavior metrics.
- Visualize and report on business performance.
Full-Text Search:
- Implement search functionality for websites and applications.
- Index and search large volumes of text data quickly.
- Provide advanced search features like faceted search and relevancy tuning.
IoT and Real-Time Data Processing:
- Collect and analyze data from IoT devices.
- Monitor and visualize sensor data in real-time.
- Perform predictive maintenance and anomaly detection.
Fraud Detection and Prevention:
- Analyze transaction data for suspicious patterns.
- Monitor and detect fraudulent activities in real-time.
- Implement machine learning models for predictive analysis.
Infrastructure Monitoring:
- Monitor server and network performance.
- Analyze infrastructure metrics for capacity planning.
- Detect and resolve issues proactively.
Compliance and Audit Reporting:
- Collect and store data for regulatory compliance.
- Generate audit reports and track compliance metrics.
- Monitor and ensure adherence to compliance policies.
These use cases demonstrate the versatility and power of the Elastic Stack in handling various data-driven scenarios, making it an invaluable tool for organizations looking to harness the power of their data.
Recommended Training: Complete Guide to Elasticsearch from Bo Andersen

Elastic Stack System Requirements
Hardware requirements for Elastic stack (Elasticsearch, Logstash and Kibana) depend upon the number of log sources and the amount of log generated. Some recommended hardware specifications are mentioned in Elasticsearch documentation.
Elastic stack requires JVM (Java Virtual Machine) to run. Therefore, we have to install a supported version of JDK (Java Development Kit) to be installed on our CentOS 7 server.
Environment Specification
Based on Elastic stack system requirements, we have configured a CentOS 7 based virtual machine with following specification.
- CPU – 3.4 Ghz (Dual Core)
- Memory – 2 GB
- Storage – 20 GB
- Operating System – CentOS 7.6
- Java Version – OpenJDK 1.8
- Hostname – elasticsearch-01.example.com
- IP Address – 192.168.116.187 /24
In this article, we will setup Elastic Stack on CentOS 7. This article provides the step by step recipe to setup each component of Elastic Stack server on CentOS 7, but it does not provide any tutorials about Elastic Stack usage and development.
Install Java on CentOS 7
Connect with elasticsearch-01.example.com using ssh as root user.
OpenJDK 8 is available in standard yum repository. Therefore, we are installing OpenJDK 8 using yum command.
yum install -y java-1.8.0-openjdk java-1.8.0-openjdk-develInstall Elasticsearch Yum Repository
The procedure to install Elasticsearch Yum Repository is available in Elasticsearch documentation. You can also install yum repositories for previous versions of Elastic stack using the same procedure.
Download and install the public signing key as follows.
rpm --import https://artifacts.elastic.co/GPG-KEY-elasticsearchCreate a new yum configuration file to install Elasticsearch Yum Repository on CentOS 7.
cat > /etc/yum.repos.d/elasticsearch.repo << EOF
[elasticsearch-7.x]
name=Elasticsearch repository for 7.x packages
baseurl=https://artifacts.elastic.co/packages/7.x/yum
gpgcheck=1
gpgkey=https://artifacts.elastic.co/GPG-KEY-elasticsearch
enabled=1
autorefresh=1
type=rpm-md
EOF
Build cache for Elasticsearch Yum Repository.
yum makecache fastWe have successfully installed Elasticsearch Yum Repository. We can now setup Elastic stack components on our CentOS 7 server.
Install Elasticsearch on CentOS 7
Install Elasticsearch 7.2 using yum command.
yum install -y elasticsearchConfigure JVM (Java Virtual Machine) options for Elasticsearch as follows.
vi /etc/elasticsearch/jvm.optionsFind and set following parameters.
-Xms256m
-Xmx512m
Enable and start Elasticsearch service.
systemctl daemon-reload
systemctl enable elasticsearch.service
systemctl start elasticsearch.service
Add Elasticsearch service port 9200/tcp in SELinux Policy as follows.
semanage port -m -t http_port_t 9200 -p tcpTest Elasticsearch configuration.
curl http://127.0.0.1:9200Output:
{
  "name" : "elasticsearch-01.example.com",
  "cluster_name" : "elasticsearch",
  "cluster_uuid" : "AkTQvcFiSwawa7mGqcH5hA",
  "version" : {
    "number" : "7.2.0",
    "build_flavor" : "default",
    "build_type" : "rpm",
    "build_hash" : "508c38a",
    "build_date" : "2019-06-20T15:54:18.811730Z",
    "build_snapshot" : false,
    "lucene_version" : "8.0.0",
    "minimum_wire_compatibility_version" : "6.8.0",
    "minimum_index_compatibility_version" : "6.0.0-beta1"
  },
  "tagline" : "You Know, for Search"
}
Elasticsearch 7.2 has been installed on our CentOS 7 server.
If there is any error during startup of Elasticsearch service then check /var/log/elasticsearch/gc.log for detailed information and troubleshooting.
Logitech G305 LIGHTSPEED Wireless Gaming Mouse, Hero 12K Sensor, 12,000 DPI, Lightweight, 6 Programmable Buttons, 250h Battery Life, On-Board Memory, PC/Mac – White
$38.34 (as of June 29, 2025 23:03 GMT +00:00 – More infoProduct prices and availability are accurate as of the date/time indicated and are subject to change. Any price and availability information displayed on [relevant Amazon Site(s), as applicable] at the time of purchase will apply to the purchase of this product.)Install Logstash on CentOS 7
Logstash is used to setup a centralized log server for other servers in a network.
Logstash 7.2 is also available in Elasticsearch yum repository. Therefore, we can easily install it using yum command.
yum install -y logstashConfigure Logstash as follows.
cat > /etc/logstash/conf.d/logstash.conf << EOF
input {
 beats {
   port => 5044
   ssl => false
   }
}

filter {
if [type] == "syslog" {
    grok {
      match => { "message" => "%{SYSLOGLINE}" }
    }

    date {
match => [ "timestamp", "MMM  d HH:mm:ss", "MMM dd HH:mm:ss" ]
}
  }
}

output {
 elasticsearch {
  hosts => localhost
    index => "%{[@metadata][beat]}-%{+YYYY.MM.dd}"
       }
stdout {
    codec => rubydebug
       }
}
EOF
Enable and start Logstash service.
systemctl enable logstash.serviceCheck /var/log/logstash/logstash-plain.log for troubleshooting Logstash service errors.
Allow Logstash service port in Linux Firewall.
firewall-cmd --permanent --add-port=5044/tcp
firewall-cmd --reload
Logstash 7.2 has been installed and configured on our CentOS 7 server.
Install Kibana on CentOS 7
Kibana 7.2 can be installed from Elasticsearch yum repository using yum command.
yum -y install kibanaConfigure Kibana settings as follows.
cat >> /etc/kibana/kibana.yml << EOF
server.port: 5601
server.host: "0.0.0.0"
server.name: "elasticsearch-01.example.com"
elasticsearch.hosts: ["http://localhost:9200"]
EOF
Enable and start Kibana service.
systemctl enable --now kibanaAllow Kibana service port in Linux firewall.
firewall-cmd --permanent --add-port=5601/tcp
firewall-cmd --reload
Kibana 7.2 has been installed and configured on our CentOS 7 server.
Install Filebeat on CentOS 7
Filebeat is an agent that sends logs to Logstash. Filebeat is also available in Elasticsearch yum repository.
Since, we are installing on the same server (elasticsearch-01.example.com), therefore, we have already installed Elasticsearch yum repository on this server. Otherwise, we have to install Elasticsearch yum repository before installing Filebeat on other CentOS 7 machines.
Install Filebeat 7.2 using yum command.
yum install -y filebeatEdit Filebeat configuration file.
vi /etc/filebeat/filebeat.ymlLocate and enabled filebeat.input section.
#=========================== Filebeat inputs =============================

filebeat.inputs:

# Each - is an input. Most options can be set at the input level, so
# you can use different inputs for various configurations.
# Below are the input specific configurations.

- type: log

  # Change to true to enable this input configuration.
  enabled: true

  # Paths that should be crawled and fetched. Glob based paths.
  paths:
    - /var/log/*.log
    #- c:programdataelasticsearchlogs*
Locate and comment all lines in output.elasticsearch section.
#-------------------------- Elasticsearch output ------------------------------
#output.elasticsearch:
  # Array of hosts to connect to.
  #hosts: ["localhost:9200"]

  # Optional protocol and basic auth credentials.
  #protocol: "https"
  #username: "elastic"
  #password: "changeme"
Locate and uncomment output.logstash section as follows.
#----------------------------- Logstash output --------------------------------
output.logstash:
  # The Logstash hosts
  hosts: ["localhost:5044"]

  # Optional SSL. By default is off.
  # List of root certificates for HTTPS server verifications
  #ssl.certificate_authorities: ["/etc/pki/root/ca.pem"]

  # Certificate for SSL client authentication
  #ssl.certificate: "/etc/pki/client/cert.pem"

  # Client Certificate Key
  #ssl.key: "/etc/pki/client/cert.key"
Enable and start Filebeat service.
systemctl enable --now filebeat.serviceFilebeat 7.2 is installed and configured on the same CentOS 7 server.
Dell Optiplex 7050 SFF Desktop PC Intel i7-7700 4-Cores 3.60GHz 32GB DDR4 1TB SSD WiFi BT HDMI Duel Monitor Support Windows 11 Pro Excellent Condition(Renewed)
$249.99 (as of June 30, 2025 20:05 GMT +00:00 – More infoProduct prices and availability are accurate as of the date/time indicated and are subject to change. Any price and availability information displayed on [relevant Amazon Site(s), as applicable] at the time of purchase will apply to the purchase of this product.)Test Elastic Stack configurations
Browse Kibana web interface http://elasticsearch-01.example.com:5601 in a client’s browser.

Click on Use own data.
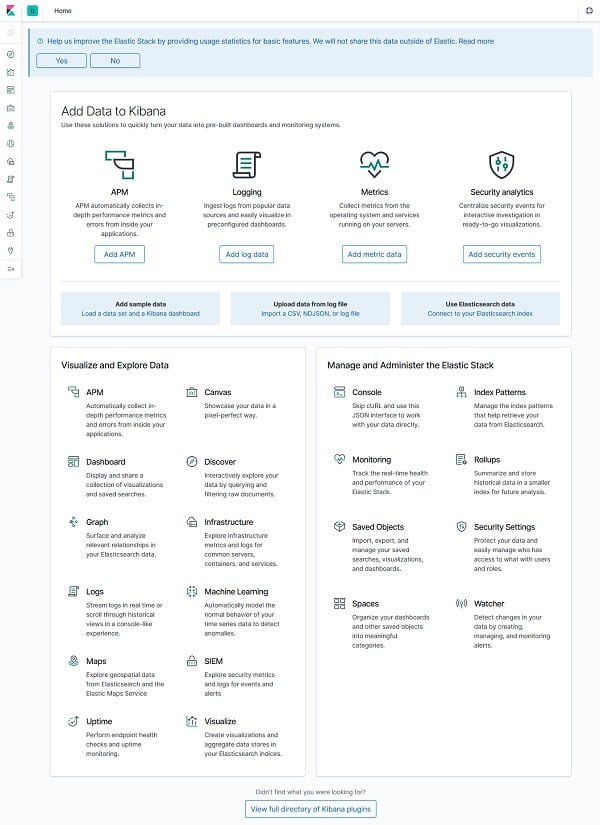
Click on Management icon under left side toolbar.
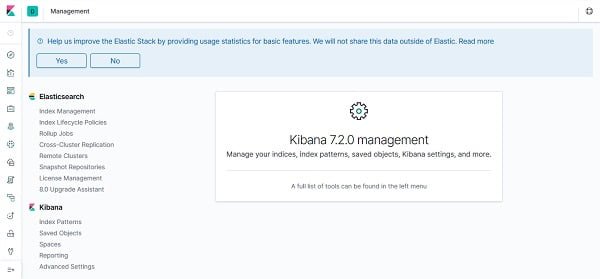
Click on Index Patterns under Kibana section.
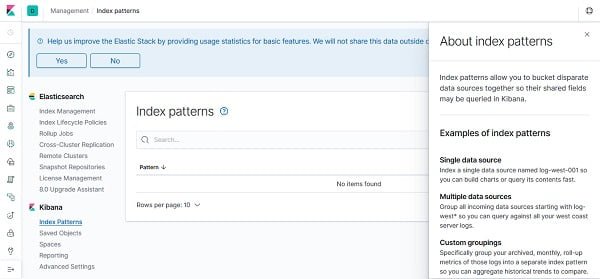
Click on Create Index Patterns.
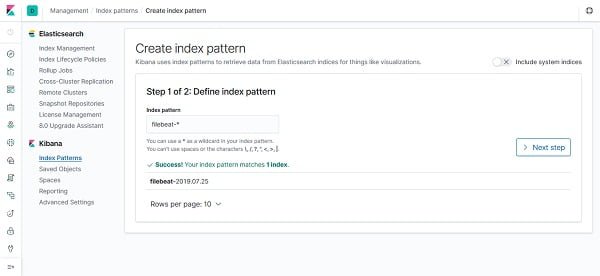
Click on > Next Step.
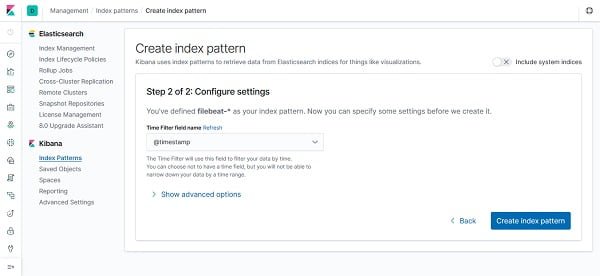
Click on Create Index.
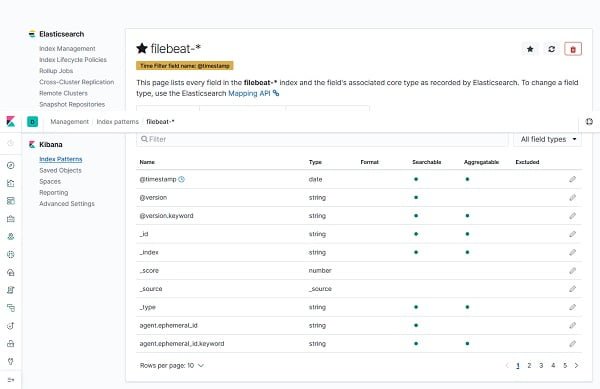
Click on Discover icon under the left toolbar.
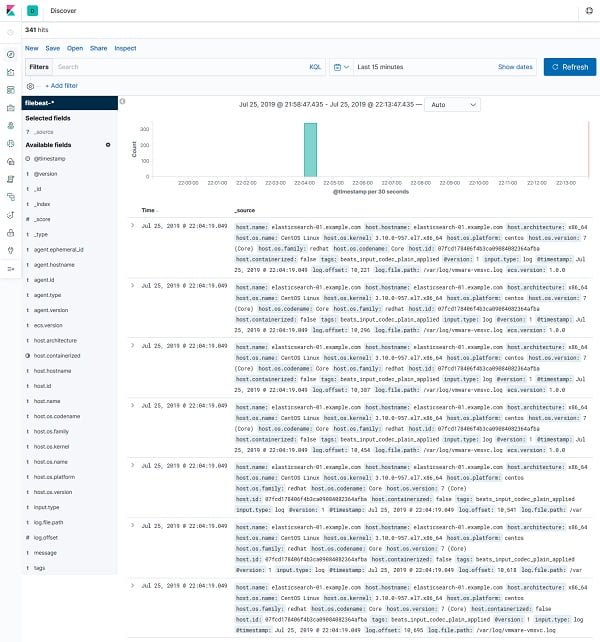
We have successfully setup Elastic Stack 7.2 on our CentOS 7 server.
Ansible Essentials: A Practical Introduction to IT Automation
$19.99 (as of June 30, 2025 20:24 GMT +00:00 – More infoProduct prices and availability are accurate as of the date/time indicated and are subject to change. Any price and availability information displayed on [relevant Amazon Site(s), as applicable] at the time of purchase will apply to the purchase of this product.)Final Thoughts
Setting up the Elastic Stack on CentOS 7 equips your infrastructure with a powerful toolset for centralized logging, real-time data analysis, and visualization. In this guide, we walked through installing and configuring Elasticsearch, Logstash, Kibana, and Beats to create a seamless data pipeline.
With the Elastic Stack fully operational, you can now collect, process, and gain valuable insights from your system and application data. To ensure long-term success, regularly monitor the performance of each component, apply security best practices, and keep the stack updated to benefit from the latest features and improvements.
Need expert AWS and Linux system administration? From cloud architecture to server optimization, I provide reliable and efficient solutions tailored to your needs. Hire me on Fiverr today!


Leave a Reply
You must be logged in to post a comment.