Easily install Prometheus software on Rocky Linux 9 with our step-by-step guide. Optimize your monitoring capabilities and ensure seamless performance tracking for your system today! #centlinux #linux #prometheus
Table of Contents
What is Prometheus Software?
Prometheus is an open-source software project, a monitoring and alerting toolkit originally developed by SoundCloud in 2012 and later donated to the Cloud Native Computing Foundation (CNCF) in 2016.
Prometheus is designed to monitor the health and performance of computer systems and applications. It follows a time-series data model, where metrics (such as CPU usage, memory consumption, network traffic, etc.) are collected and stored over time. These metrics can then be analyzed, graphed, and used for alerting purposes.
Key features of Prometheus include:
- Metrics Collection: Prometheus provides various libraries and integrations that allow developers to instrument their applications and collect metrics. It supports multiple data formats, including a specialized query language called PromQL.
- Data Storage: Prometheus uses its custom time-series database for efficient storage and retrieval of metrics. The collected data is stored locally, making it easy to scale and operate.
- Alerting: Prometheus supports rule-based alerting, allowing users to define alert conditions based on metric thresholds or complex expressions. When an alert is triggered, notifications can be sent through various channels, such as email, PagerDuty, or webhooks.
- Visualization: Prometheus has a built-in graphical interface called the Prometheus Expression Browser, which allows users to explore and graph metrics in real-time. Additionally, it can be integrated with visualization tools like Grafana for more advanced data visualization.
Prometheus has gained popularity in the realm of cloud-native applications and is often used in conjunction with other technologies like Kubernetes for monitoring and observability purposes. Its flexibility, scalability, and active community support have made it a widely adopted monitoring solution in the software development community.

Environment Specification
We are using a minimal Rocky Linux 9 virtual machine with following specifications.
- CPU – 3.4 Ghz (2 cores)
- Memory – 4 GB
- Storage – 40 GB
- Operating System – Rocky Linux release 9.2 (Blue Onyx)
- Hostname – prometheus-01.centlinux.com
- IP Address – 192.168.116.133/24
For setting up a reliable virtual lab to install and test Prometheus on Rocky Linux 9, you have a couple of excellent options. If you prefer building a home lab, a Mini PC offers a compact yet powerful solution that can easily handle Linux servers, containers, and monitoring workloads. [Check Mini PC prices at Amazon]
On the other hand, if you want a scalable cloud-based environment without worrying about hardware, a Hostinger VPS provides affordable and high-performance infrastructure for experimenting with Prometheus and other DevOps tools. Both choices give you flexibility to practice, learn, and deploy in real-world scenarios. [Get a Hostinger VPS at Discounted rate Now!]
Disclosure: Some of the links above are affiliate links, meaning I may earn a small commission at no extra cost to you. This helps support the site and allows me to keep creating detailed Linux and DevOps tutorials.
Prepare your Rocky Linux Server
Login as root user on your Rocky Linux server with the help of a SSH client.
Set a Fully Qualified Domain Name (FQDN) and configure Local DNS resolution for your Linux machine.
hostnamectl set-hostname prometheus-01.centlinux.com
echo "192.168.116.133 prometheus-01 prometheus-01.centlinux.com" >> /etc/hosts
To confirm your Local DNS settings, execute ping command on Linux terminal.
ping prometheus-01Output:
PING prometheus-01 (192.168.116.133) 56(84) bytes of data.
64 bytes from prometheus-01 (192.168.116.133): icmp_seq=1 ttl=64 time=0.128 ms
64 bytes from prometheus-01 (192.168.116.133): icmp_seq=2 ttl=64 time=0.143 ms
^C
--- prometheus-01 ping statistics ---
2 packets transmitted, 2 received, 0% packet loss, time 1051ms
rtt min/avg/max/mdev = 0.128/0.135/0.143/0.007 ms
Update software packages in your Linux OS by executing following command at Linux terminal.
dnf update -ySometimes, the above dnf command updates software packages related to Linux Kernel. If this happens then you should reboot your Linux OS before installing Prometheus software.
rebootNote down the Linux OS and Kernel versions, that are being used in this tutorial.
cat /etc/rocky-release
uname -r
Output:
Rocky Linux release 9.2 (Blue Onyx)
5.14.0-284.11.1.el9_2.x86_64
Install required software packages as follows.
dnf install -y wget tar grubbyRead Also: How to install Prometheus on CentOS 8
Disabling SELinux
Prometheus software does not have an official SELinux policy. Therefore, you have to permanently disable SELinux for proper functioning of your network monitoring tool.
In most Linux distributions, SELinux by default runs in Enforcing mode.
You can verify this with the help of getenforce command.
getenforceOutput:
Enforcing
Execute following command to permanently disable SELinux.
grubby --update-kernel ALL --args selinux=0Reboot your machine now.
rebootAgain, check the status of SELinux by using getenforce command.
getenforceOutput:
Disabled
SELinux has been permanently disabled.
Create Linux Users & Directories
Create a Linux user to own Prometheus software and processes.
useradd --no-create-home -s /bin/false prometheusCreate required Prometheus directories and change the ownership.
mkdir /etc/prometheus
mkdir /var/lib/prometheus
chown prometheus:prometheus /etc/prometheus
chown prometheus:prometheus /var/lib/prometheus
Installing Prometheus on Rocky Linux 9
You can install Prometheus software on Linux by downloading the setup from Prometheus official website.
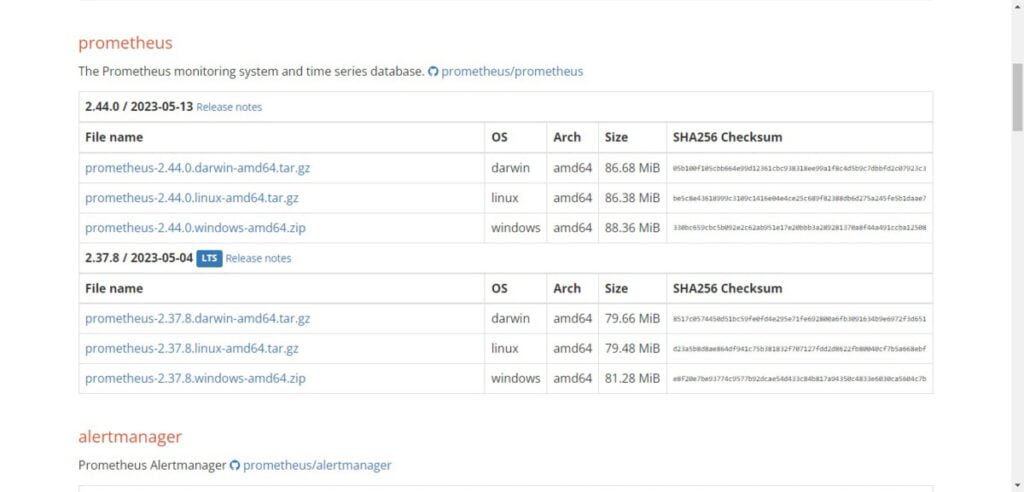
Copy the URL of your required version of Network monitoring software and then use wget command to download Prometheus tarball.
wget https://github.com/prometheus/prometheus/releases/download/v2.44.0/prometheus-2.44.0.linux-amd64.tar.gzAfter download, extract the tarball by using tar command.
tar xf prometheus-2.44.0.linux-amd64.tar.gz -C /var/lib/prometheus/ --strip-components=1Adjust the ownership of Prometheus installation directory.
chown -R prometheus:prometheus /var/lib/prometheusMove Prometheus default configuration file to /etc/prometheus directory.
mv /var/lib/prometheus/prometheus.yml /etc/prometheus/Prometheus configurations are stored in YAML file. Therefore, you can easily edit prometheus.yml in vim text editor.
vi /etc/prometheus/prometheus.ymlFind following directives therein.
    static_configs:
      - targets: ["localhost:9090"]
And change it as follows.
    static_configs:
      - targets: ["192.168.116.133:9090"]
Create symbolic links for Prometheus commands at /usr/bin directory, to make them globally executable from any path.
ln -s /var/lib/prometheus/prometheus /usr/bin
ln -s /var/lib/prometheus/promtool /usr/bin
To enable auto-start of Prometheus server, you are required to create a systemd service unit.
Create a systemd unit file by using vim text editor.
vi /usr/lib/systemd/system/prometheus.serviceAdd following directives in this file.
[Unit]
Description=Prometheus
Wants=network-online.target
After=network-online.target

[Service]
User=prometheus
Group=prometheus
Type=simple
ExecStart=/usr/bin/prometheus
--config.file /etc/prometheus/prometheus.yml
--storage.tsdb.path /var/lib/prometheus/
--web.console.templates=/var/lib/prometheus/consoles
--web.console.libraries=/var/lib/prometheus/console_libraries

[Install]
WantedBy=multi-user.target
Enable and start Prometheus service.
systemctl enable --now prometheus.serviceVerify the status of Prometheus service for any errors.
systemctl status prometheus.serviceOutput:
● prometheus.service - Prometheus
     Loaded: loaded (/usr/lib/systemd/system/prometheus.service; enabled; prese>
     Active: active (running) since Sun 2023-05-21 22:22:35 PKT; 56s ago
   Main PID: 1692 (prometheus)
      Tasks: 8 (limit: 23011)
     Memory: 26.0M
        CPU: 515ms
     CGroup: /system.slice/prometheus.service
             └─1692 /usr/bin/prometheus --config.file /etc/prometheus/prometheu>

May 21 22:22:35 prometheus-01.centlinux.com prometheus[1692]: ts=2023-05-21T17:>
May 21 22:22:35 prometheus-01.centlinux.com prometheus[1692]: ts=2023-05-21T17:>
May 21 22:22:35 prometheus-01.centlinux.com prometheus[1692]: ts=2023-05-21T17:>
Prometheus network monitoring server uses default port 9090/tcp. Therefore, it is necessary to allow it in Linux firewall, to make your service accessible across the network.
firewall-cmd --permanent --add-port=9090/tcp
firewall-cmd --reload
Open URL http://prometheus-01.centlinux.com:9090 in your favorite web browser.
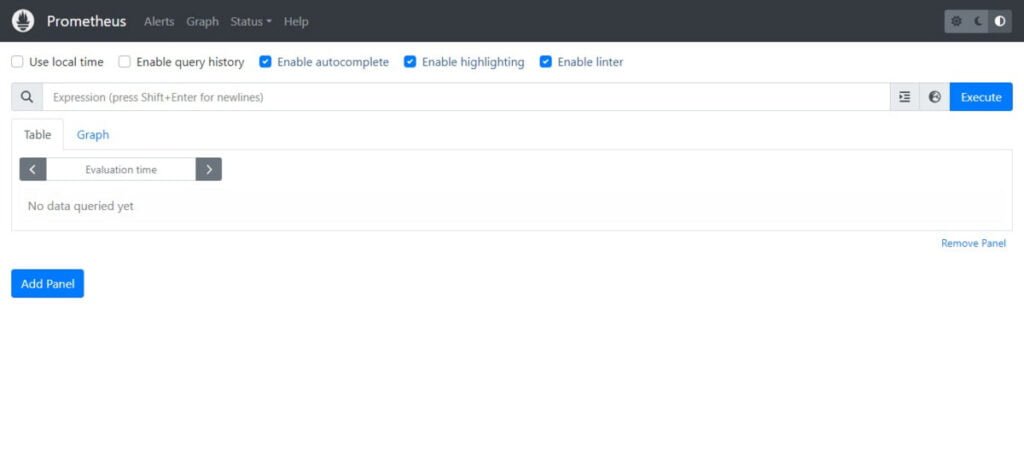
Open Status > Targets from top menu.
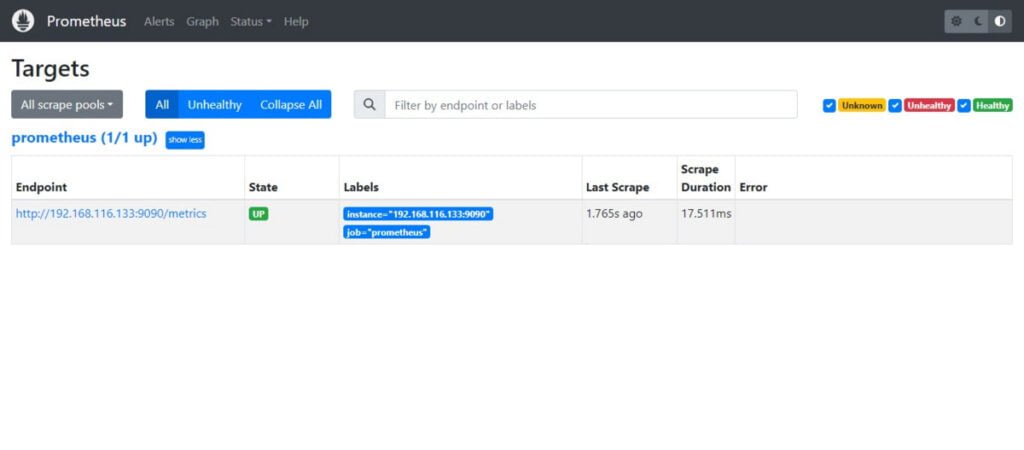
Prometheus has been installed on your Rocky Linux server.
Install Node Exporter on Rocky Linux 9
Node Exporter is a specialized Prometheus exporter designed to provide detailed server-level and operating system-level metrics. It serves as a key component in monitoring infrastructure, offering insights into the performance and health of servers. With its highly configurable metric collectors, Node Exporter enables users to gather a wide range of metrics that are essential for efficient resource management and system optimization.
This tool is particularly valuable for tracking critical server resources, including RAM usage, disk space availability, and CPU utilization. By capturing these metrics, Node Exporter helps administrators identify potential bottlenecks, monitor resource consumption trends, and ensure that the servers are operating within optimal parameters. Whether you’re managing a single server or an entire fleet, this exporter provides granular visibility into the hardware and operating system, enabling proactive management and troubleshooting.
In addition to its default metrics, Node Exporter can be customized to collect data specific to your needs, such as network usage, file descriptor counts, and more. This flexibility makes it an indispensable tool for fine-tuning system performance and ensuring high availability. By integrating Node Exporter with Prometheus, you can visualize these metrics in real-time and set up alerts to respond to anomalies, ensuring your infrastructure remains robust and reliable.
After you install Prometheus software on Linux, You should also install node_exporter on your Prometheus server to gather metrics.
Create a directory for Node Exporter software.
mkdir -p /var/lib/prometheus/node_exporterYou can also copy the URL of Node Exporter from Prometheus official download page.
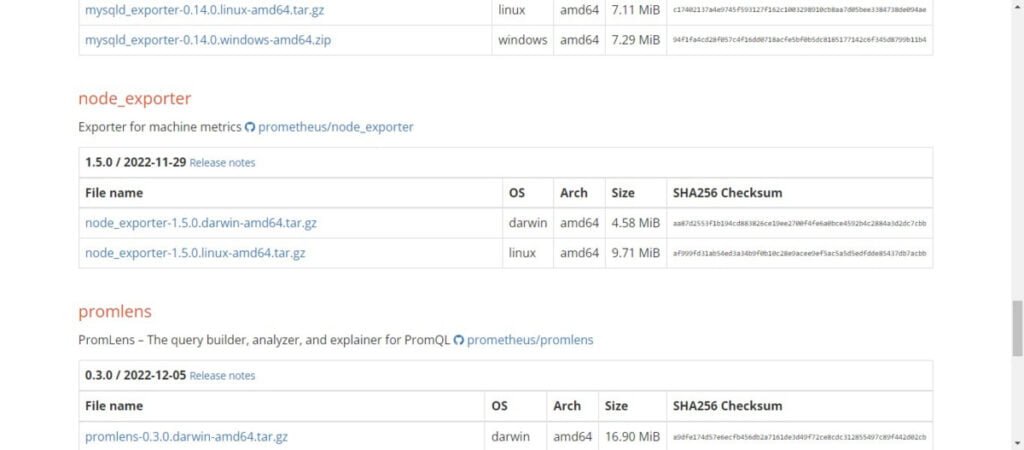
Use wget command with copied URL to download Node Exporter.
wget https://github.com/prometheus/node_exporter/releases/download/v1.5.0/node_exporter-1.5.0.linux-amd64.tar.gzExtract downloaded tarball by using tar command.
tar xf node_exporter-1.5.0.linux-amd64.tar.gz -C /var/lib/prometheus/node_exporter/ --strip-components=1Adjust the ownership of node_exporter directory.
chown -R prometheus:prometheus /var/lib/prometheus/node_exporter/Create a symbolic link for node_exporter at /usr/bin directory.
ln -s /var/lib/prometheus/node_exporter/node_exporter /usr/bin/Enable auto-start of node_exporter process, create a systemd service unit.
vi /usr/lib/systemd/system/node_exporter.serviceAdd following lines of code in this file.
[Unit]
Description=Node Exporter
Wants=network-online.target
After=network-online.target

[Service]
User=prometheus
ExecStart=/usr/bin/node_exporter

[Install]
WantedBy=default.target
Enable and start node_exporter service.
systemctl enable --now node_exporter.serviceConfigure Linux firewall to allow node_exporter default port 9100/tcp.
firewall-cmd --permanent --add-port=9100/tcp
firewall-cmd --reload
Edit Prometheus configuration file in vim text editor.
vi /etc/prometheus/prometheus.ymlAdd the node_exporter endpoint configuration in this file. As you see, it is a .yml file, so you should be very careful with the spaces and indention while editing this file.
  - job_name: 'node_exporter'
    static_configs:
      - targets: ['localhost:9100']
Restart Prometheus service to load new configurations.
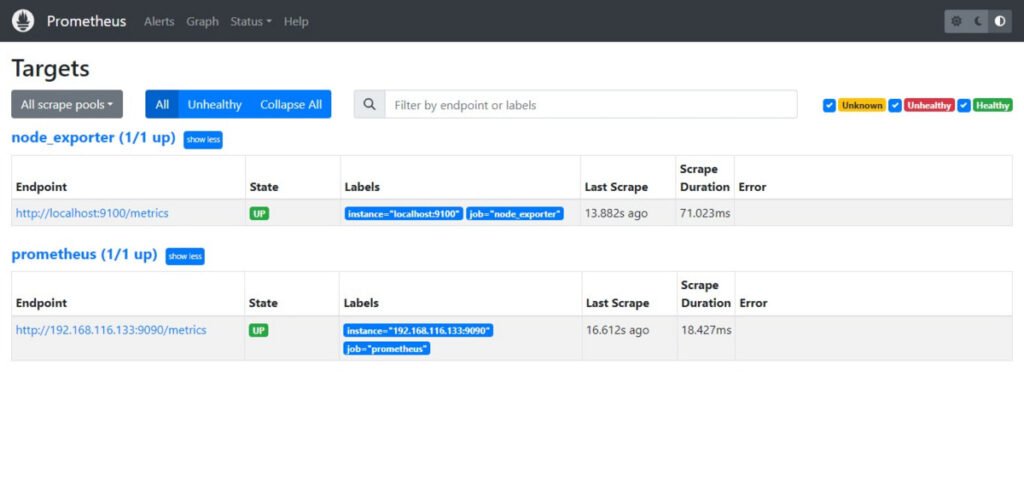
systemctl restart prometheus.serviceOpen Status > Targets or refresh the web page, if already opened.
Video Tutorial
Final Thoughts
As you embark on the journey to install Prometheus software on Rocky Linux 9, empower your monitoring capabilities and ensure the seamless performance of your system. With our comprehensive guide, navigating the installation process becomes effortless, allowing you to leverage Prometheus to its fullest potential. Let’s elevate your monitoring infrastructure together and unlock new insights into your system’s health and performance.
Searching for a skilled Linux admin? From server management to security, I ensure seamless operations for your Linux systems. Find out more on my Freelancer profile!
FAQs
1. Can Prometheus run on older versions of Rocky Linux or other similar distros?
Yes, Prometheus can run on older Rocky Linux versions and other Red Hat-based distros, but package availability and system dependencies may vary.
2. Do I need to configure a firewall to allow Prometheus monitoring?
Yes, ensure ports like 9090 (Prometheus default) are open on your firewall to enable remote scraping and access to the Prometheus UI.
3. Is it necessary to create a dedicated user for running Prometheus?
It’s a best practice to run Prometheus under a non-root, dedicated system user for improved security and process isolation.
4. How can I confirm Prometheus is properly scraping targets after installation?
Check the Prometheus web UI’s “Targets” page to see if your monitored endpoints show as “UP,” indicating successful scraping.
5. Can Prometheus data persist after system reboot on Rocky Linux 9?
Yes, Prometheus stores data in local disk folders specified in its config, so ensure the directories have proper permissions and persistent storage configured.
What’s Next
If you’re serious about mastering infrastructure monitoring and alerting with Prometheus, I highly recommend checking out the course “Prometheus | The Complete Hands-On for Monitoring & Alerting” by A to Z Mentors.
This step-by-step training is perfect for system administrators, DevOps engineers, and cloud professionals who want practical, real-world skills to set up Prometheus, integrate alerting systems, and keep mission-critical applications running smoothly. It’s a valuable investment in your career growth and will help you stay ahead in the fast-moving DevOps world.
(Disclaimer: This page contains affiliate links. If you purchase through these links, I may earn a small commission at no extra cost to you.)


Leave a Reply
You must be logged in to post a comment.